Keeping Power BI Incremental Refresh Up To Date
A alternate solution to a solution by Nikolaos Christoforidis for keeping local Incremental Refresh Reports up to date
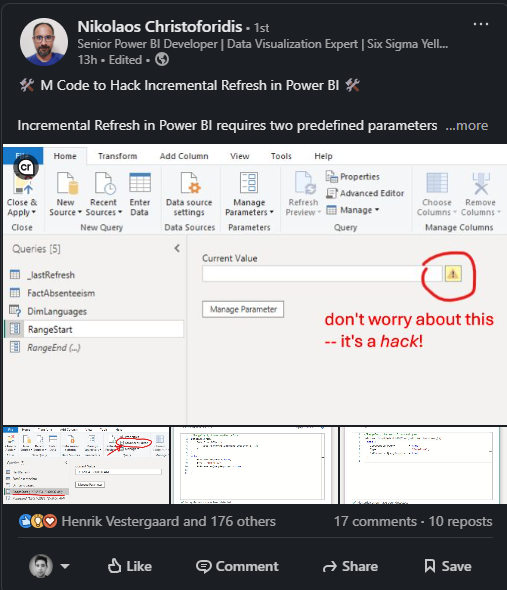
A alternate solution to a solution by Nikolaos Christoforidis for keeping local Incremental Refresh Reports up to date
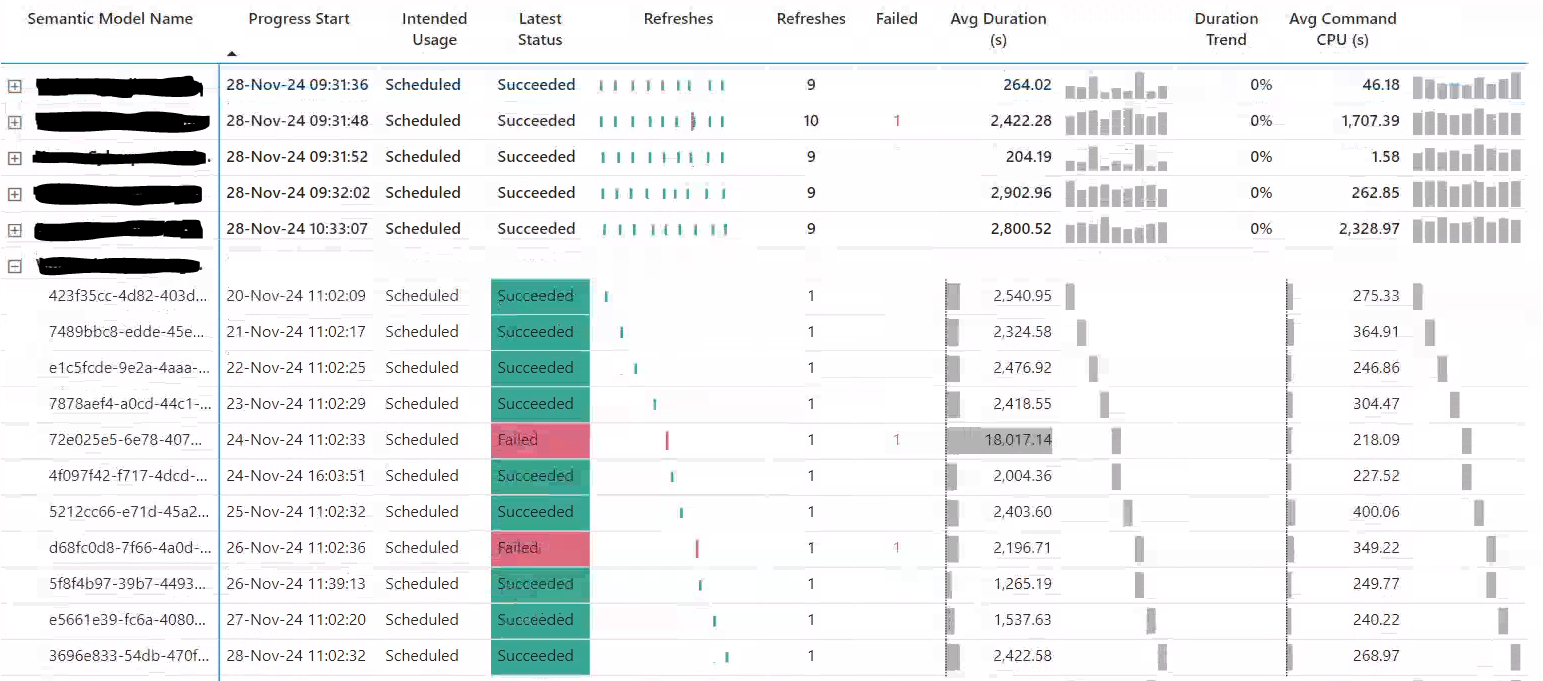
Using Power BI Logs, Report metadata and SVG to visual visual performance and usage with a page heatmap
Optimizing the SVG Heatmap using the Sparkline measure pattern
Using the ad hoc measures created by sparklines to optimize SVG generating measures
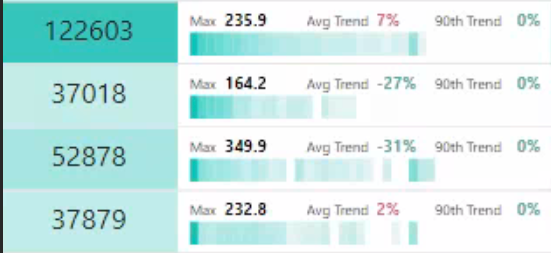
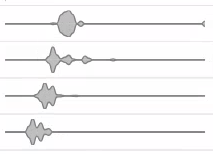
Creating a SVG Violin to visualize distributions in Power BI
Creating a Heatmap SVG to visualize distributions

Creating a Trend SVG Visual in Power BI
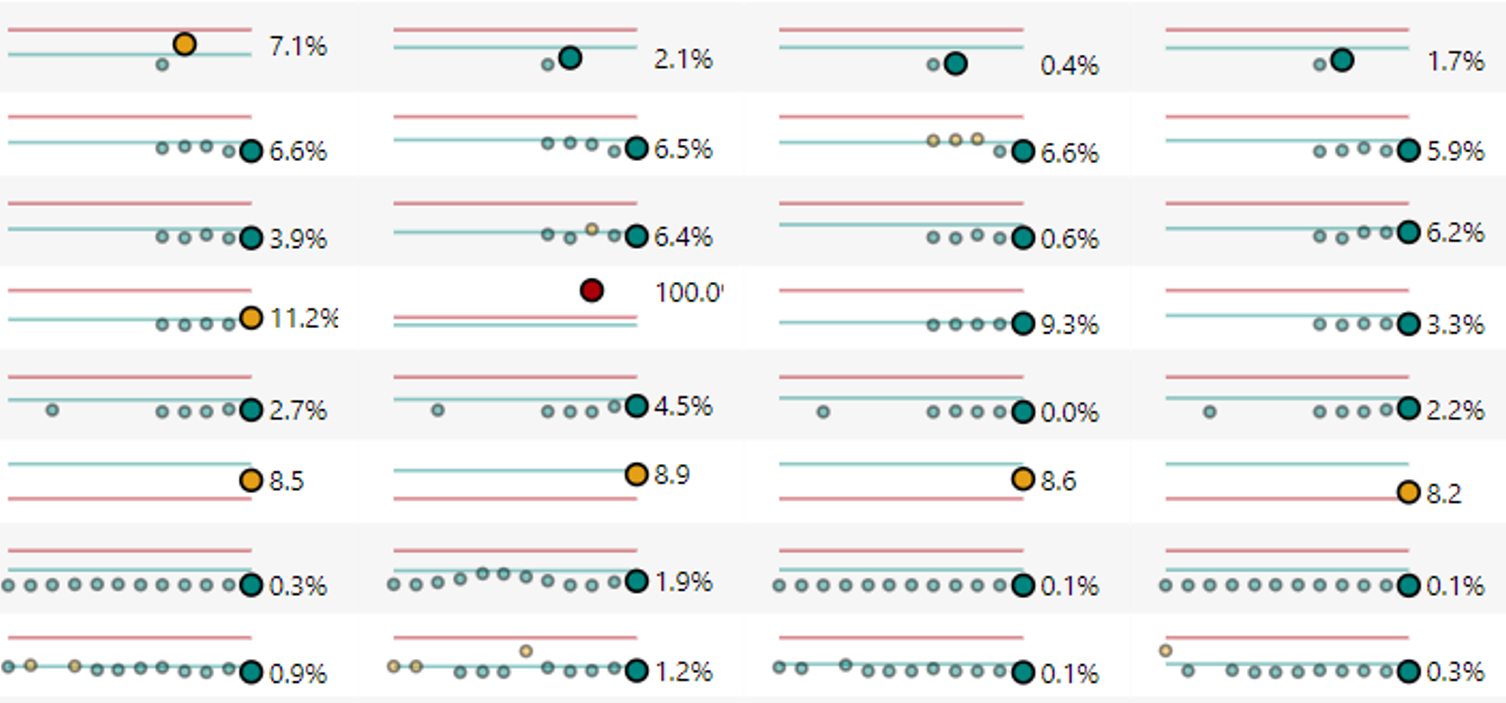
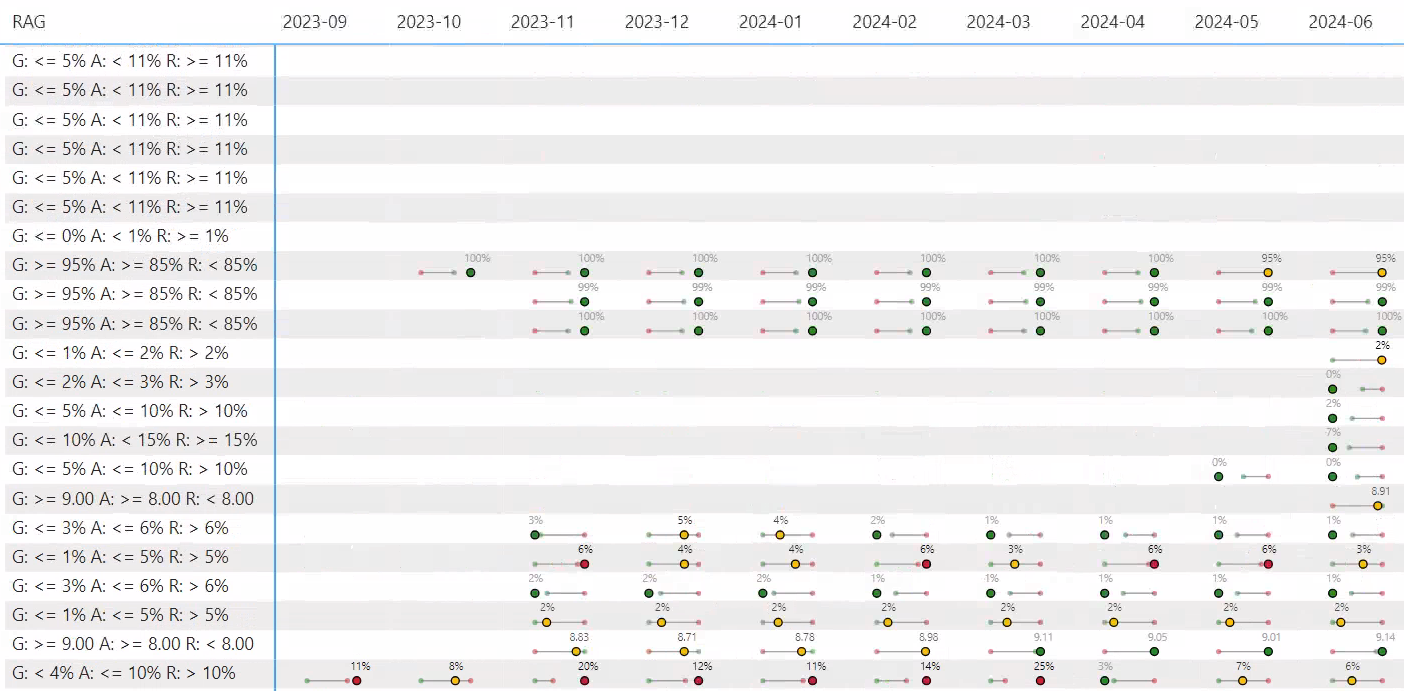
Using DAX to create a SVG Dumbbell chart in Power BI
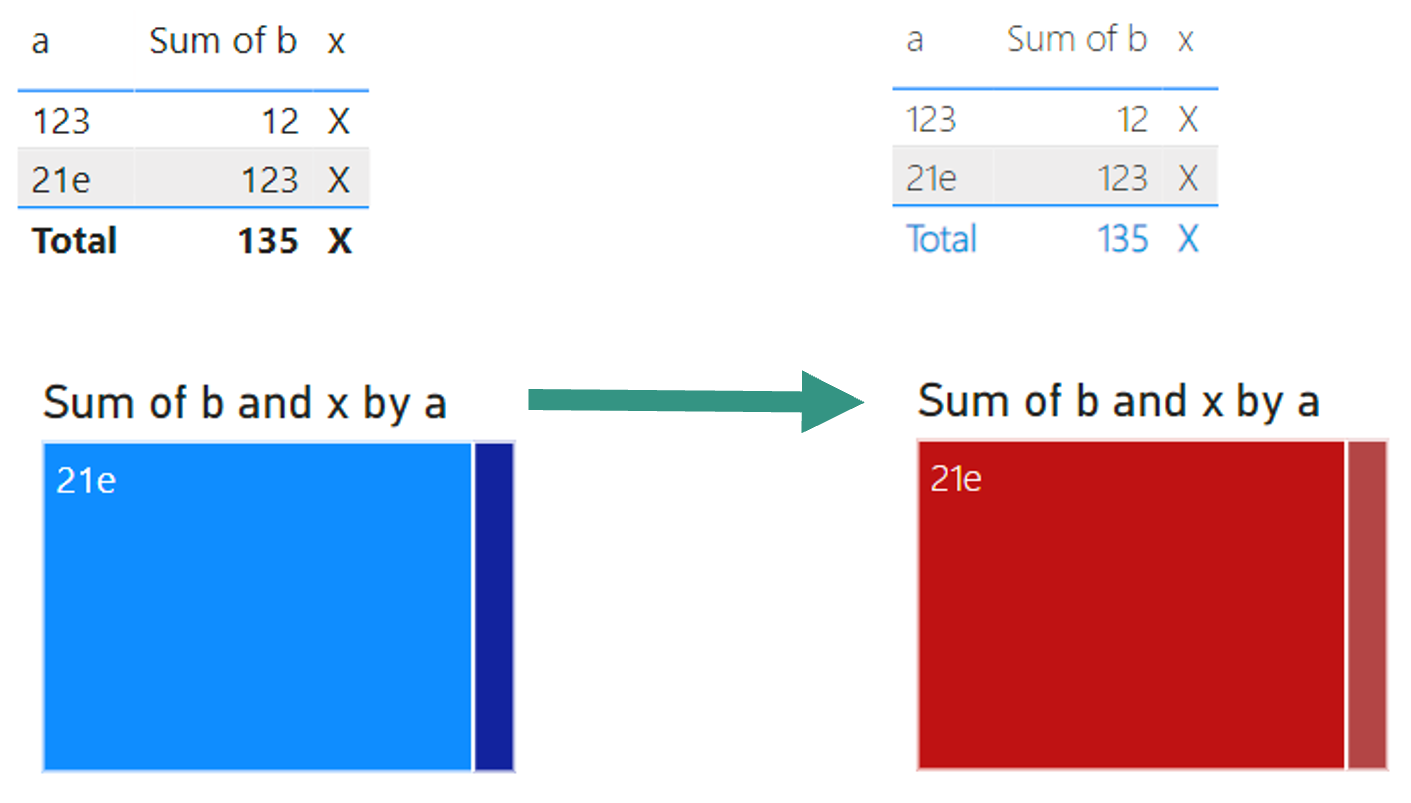
Defining a Theme in a Git Submodule that can be injected into Reports in other repos upon deployment
How does Delta Lake Uplift a Data Lake to a Lakehouse