Vertipaq Analyzer, Deep Dive
Exploring how Semantic Link Labs and SQLBI's Vertipaq Analyzers work

Exploring how Semantic Link Labs and SQLBI's Vertipaq Analyzers work
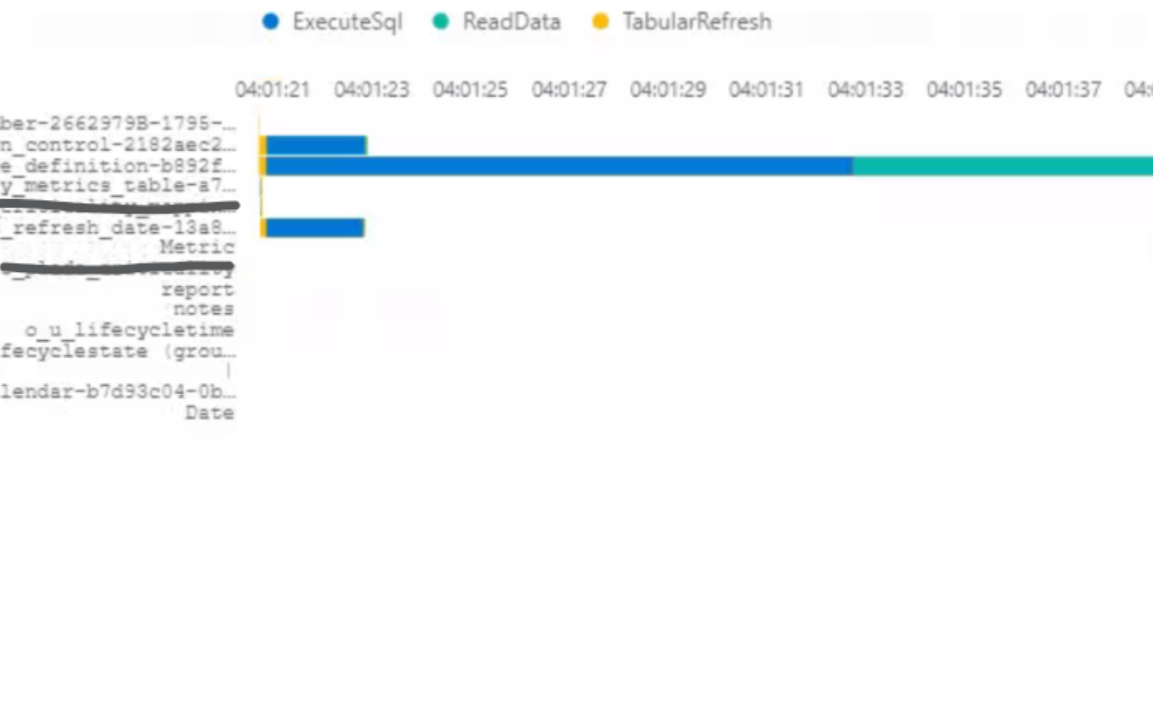
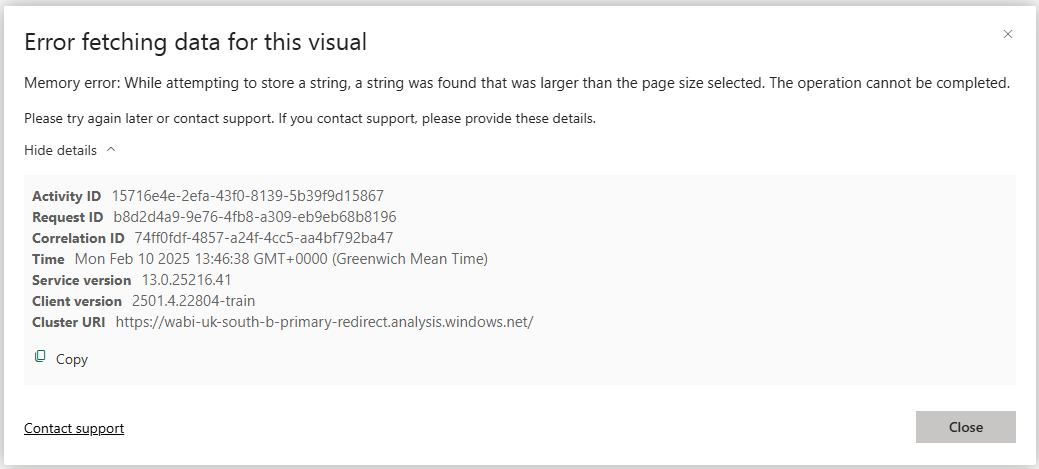
Minimizing SVG Strings to Avoid Hitting Power BI Memory Limits
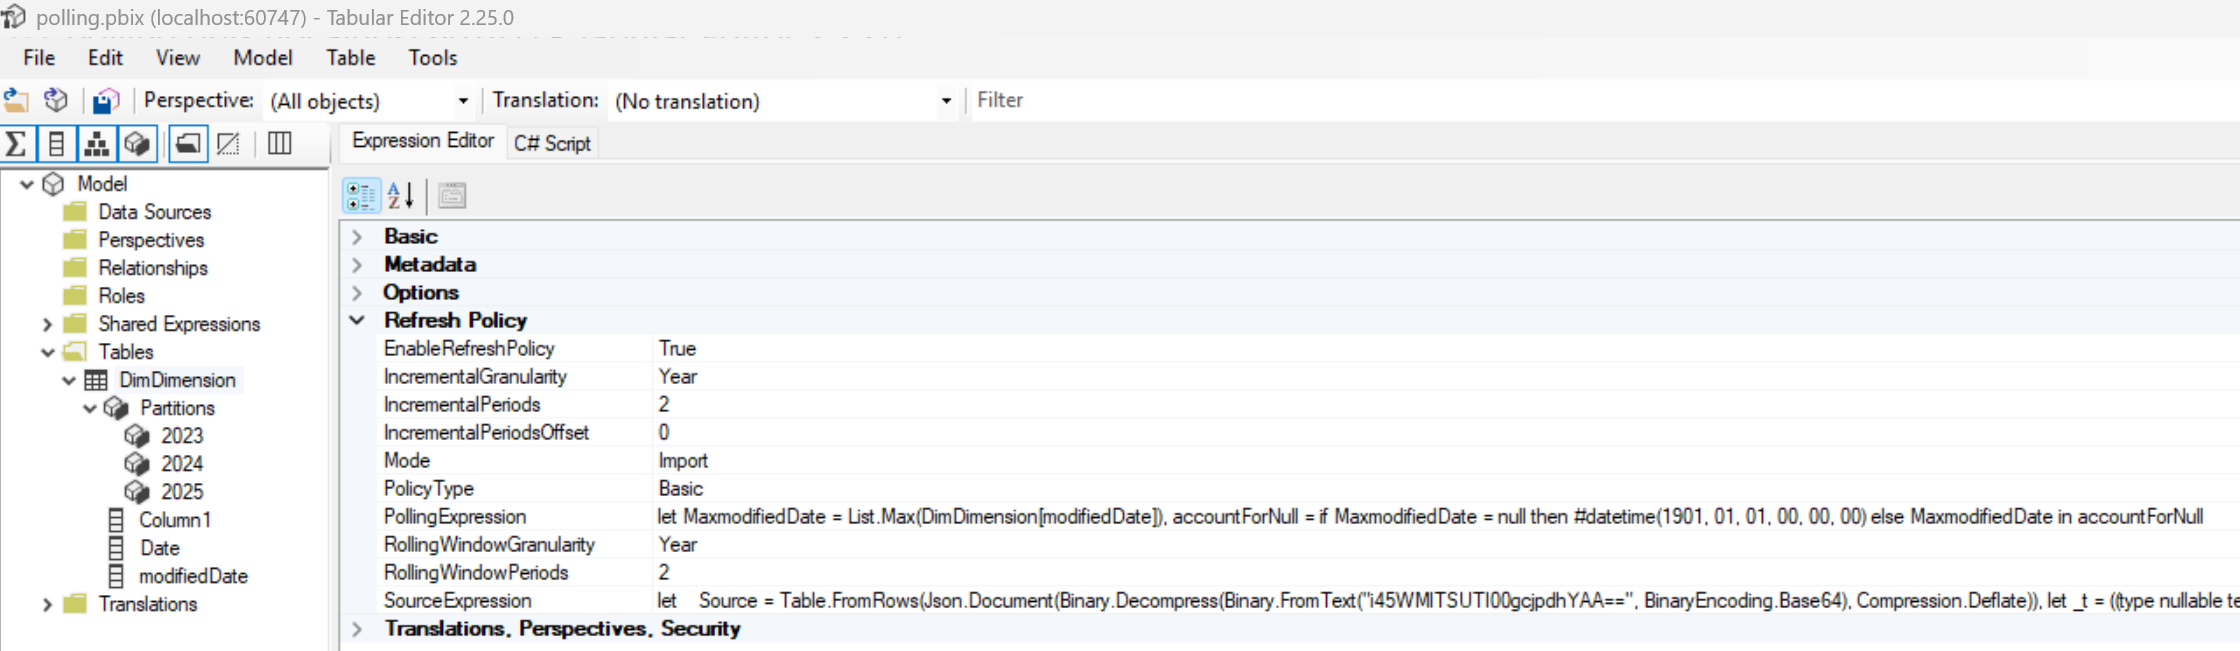
Incremental Refresh on Slowly Changing Dimension in Power BI
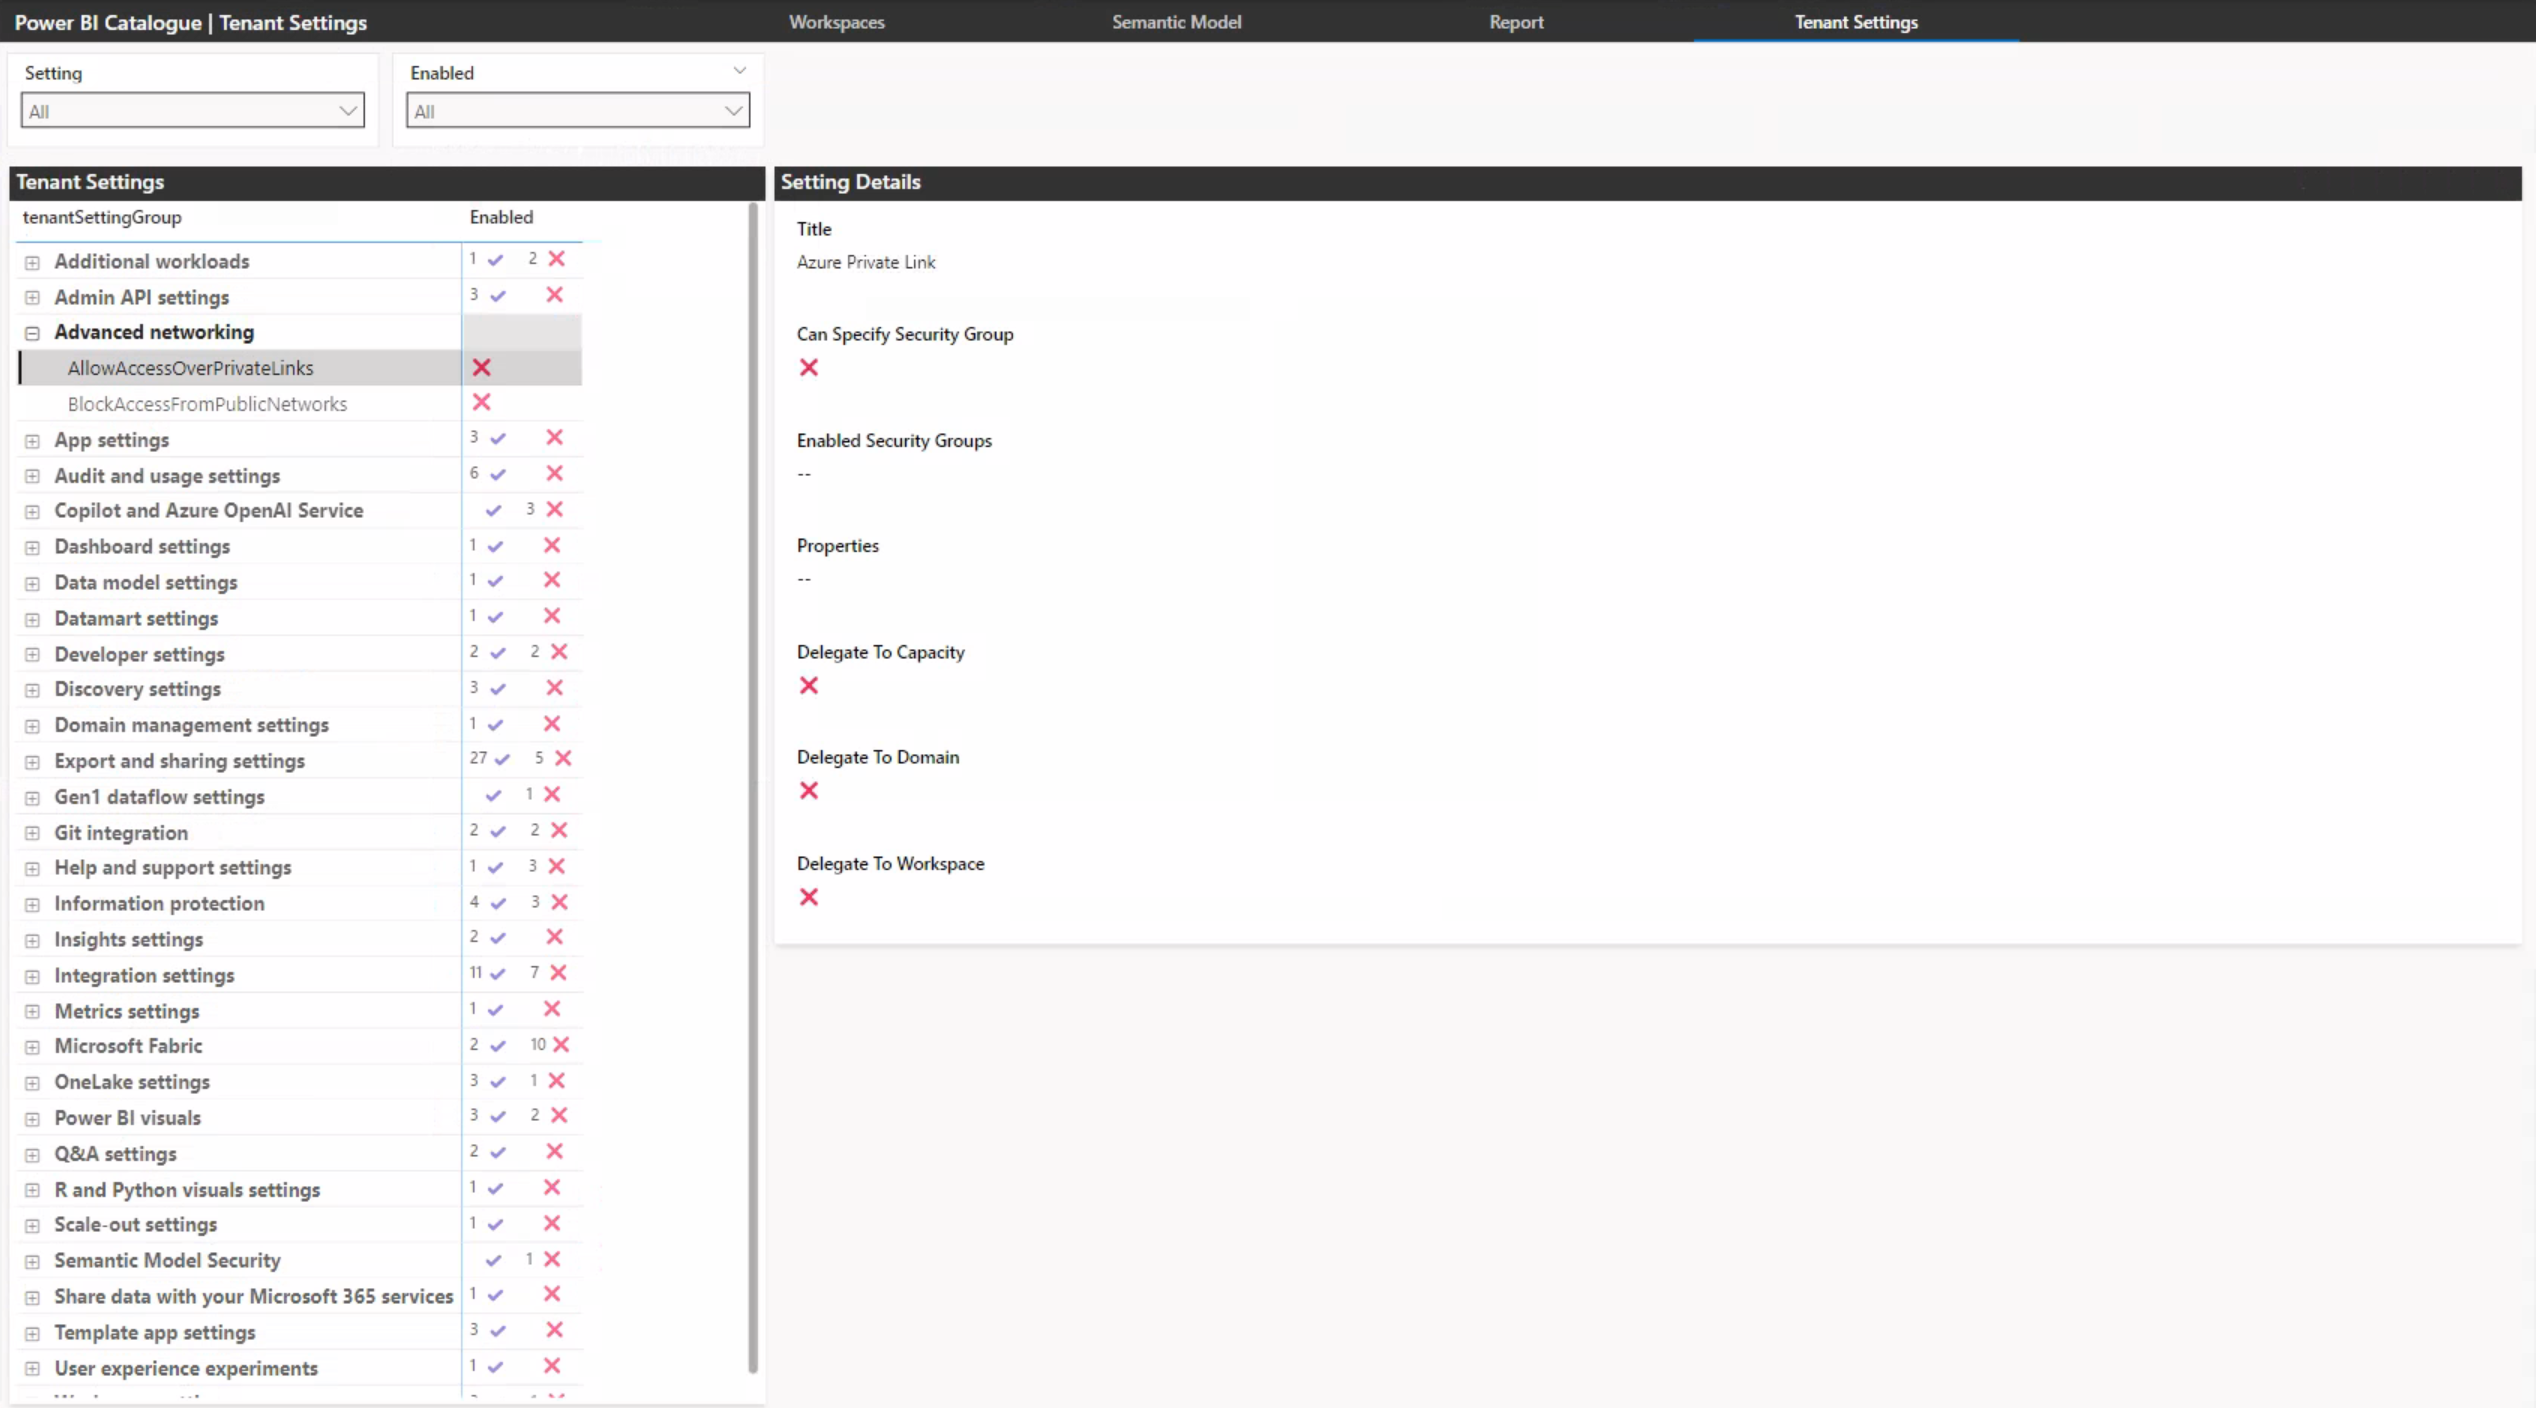
Exporting Power BI Tenant Settings with the Fabric List Tenant Settings API
Using Label Propagation to attempt to obtain cluster of users that can used to define personas, to simplify granting of permissions
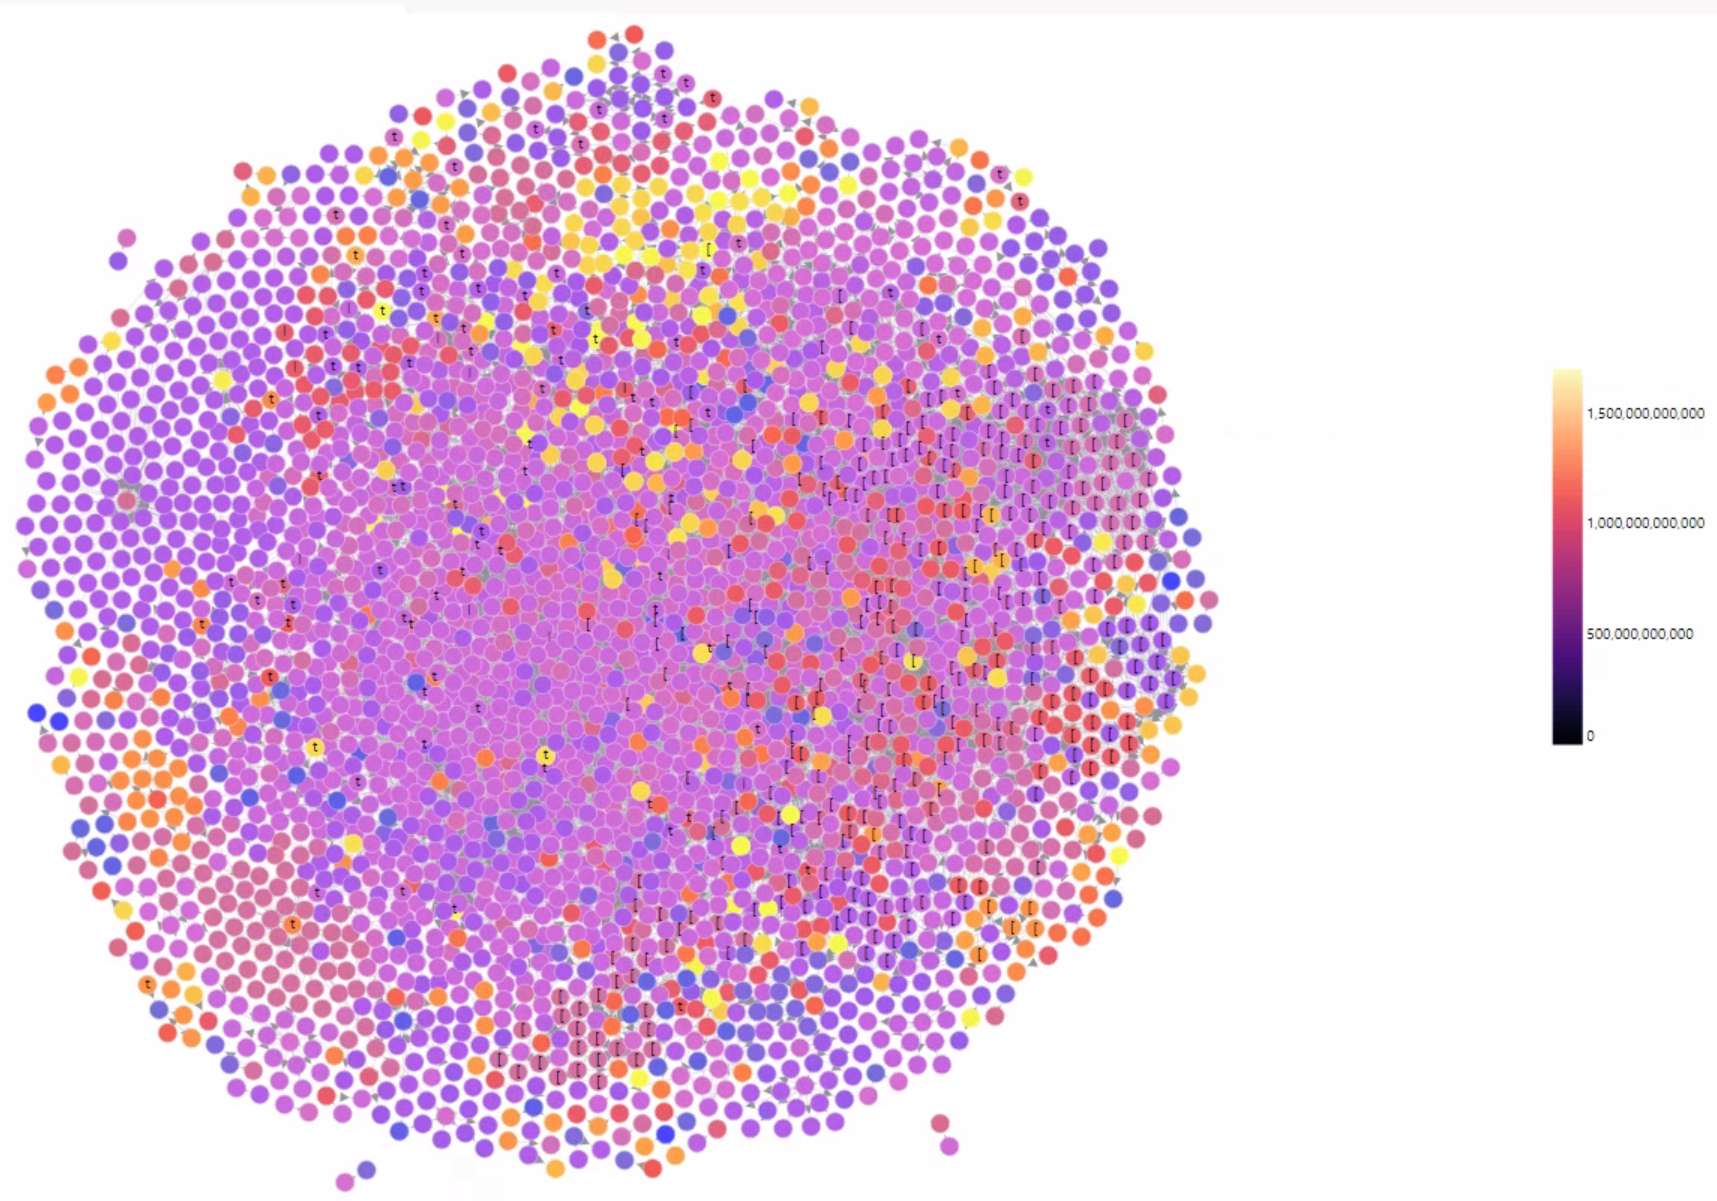
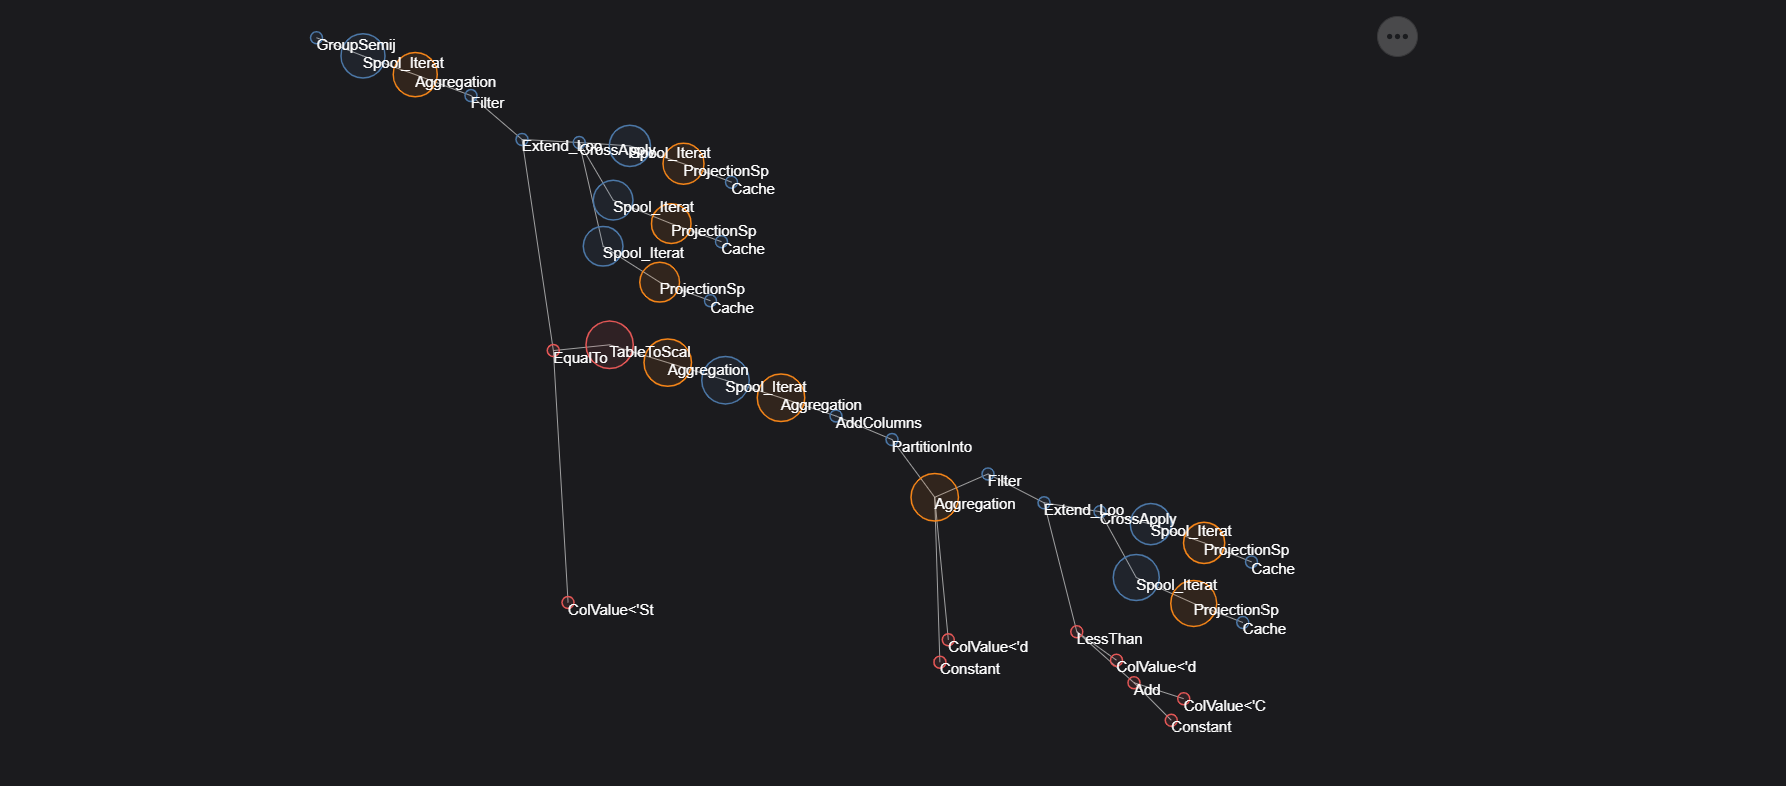
Using Vega Force Directed Graphs to visualizing DAX Query Plans
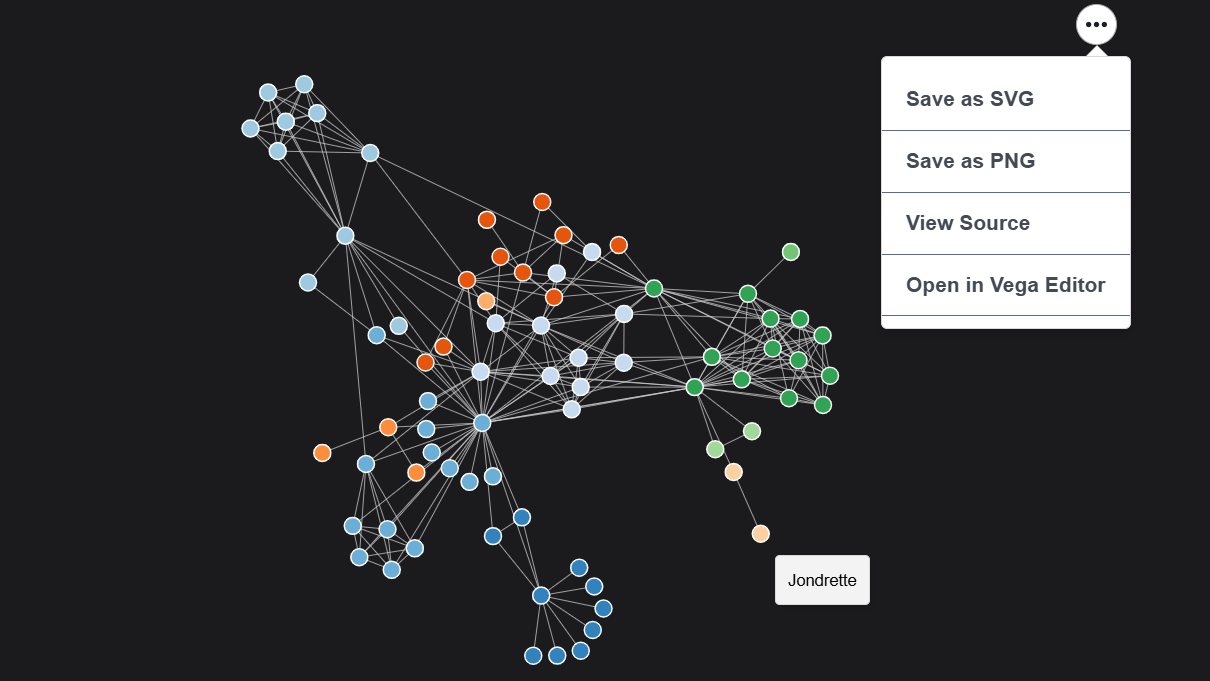
Using Deneb Force Directed Graph to visualizing the inheritance of Power BI permission
Using Power BI Scanner and GraphFrames to figure out who can access what in Power BI tenant

Installing and using Vega Embed on my Blog
Using Deneb and Vega-Lite to create a Gantt Chart if Power BI