Monitoring for Power BI Admins
What is going on in your Power BI Tenant?
Administration of a Power BI tenant can be tough. You have tread the line of giving developer space to develop reports to meet the companies reporting requirements, whilst also make sure the platform runs smoothly. A single report, that was not fully reviewed can consume all your CUs, leading to throttling and service degradation. What options are there for tenant observability?
Fabric Capacity Metrics App
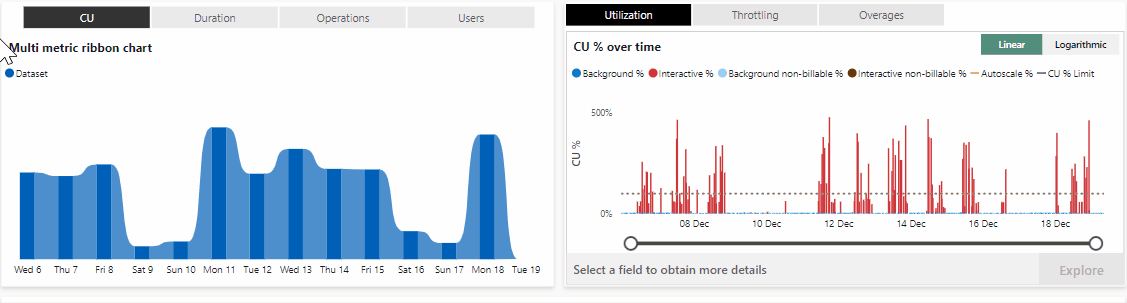
The most important report provided is one provided by Microsoft, the Fabric Capacity Metrics App. You need to install this from the App store.
When you purchase a capacity, you get a set number of Capacity Units (CU) to perform any compute. For P1/F64, for example, this is 64 CU per second, which you can use to perform operations. There are two types of operations; Background operations, which are long duration, high CU tasks like Semantic Model refreshes, and Interactive operations for short term, low CU operations like queries from Power BI report visuals. In general usage of the capacity can be quite spiky, smoothing is applied to help even out the spikes, averaging out a operations CUs over a period of time. Background operations are smoothed over 24 hours and Interactive operations over 5 minutes. If you exceed your allocated limit you can experience various tier of throttling.
The Fabric Capacity Metrics App shows your usage of the CUs over time. This allows you to keep track of your usage, identify expensive Semantic Models for optimization work, or load balance between capacities.
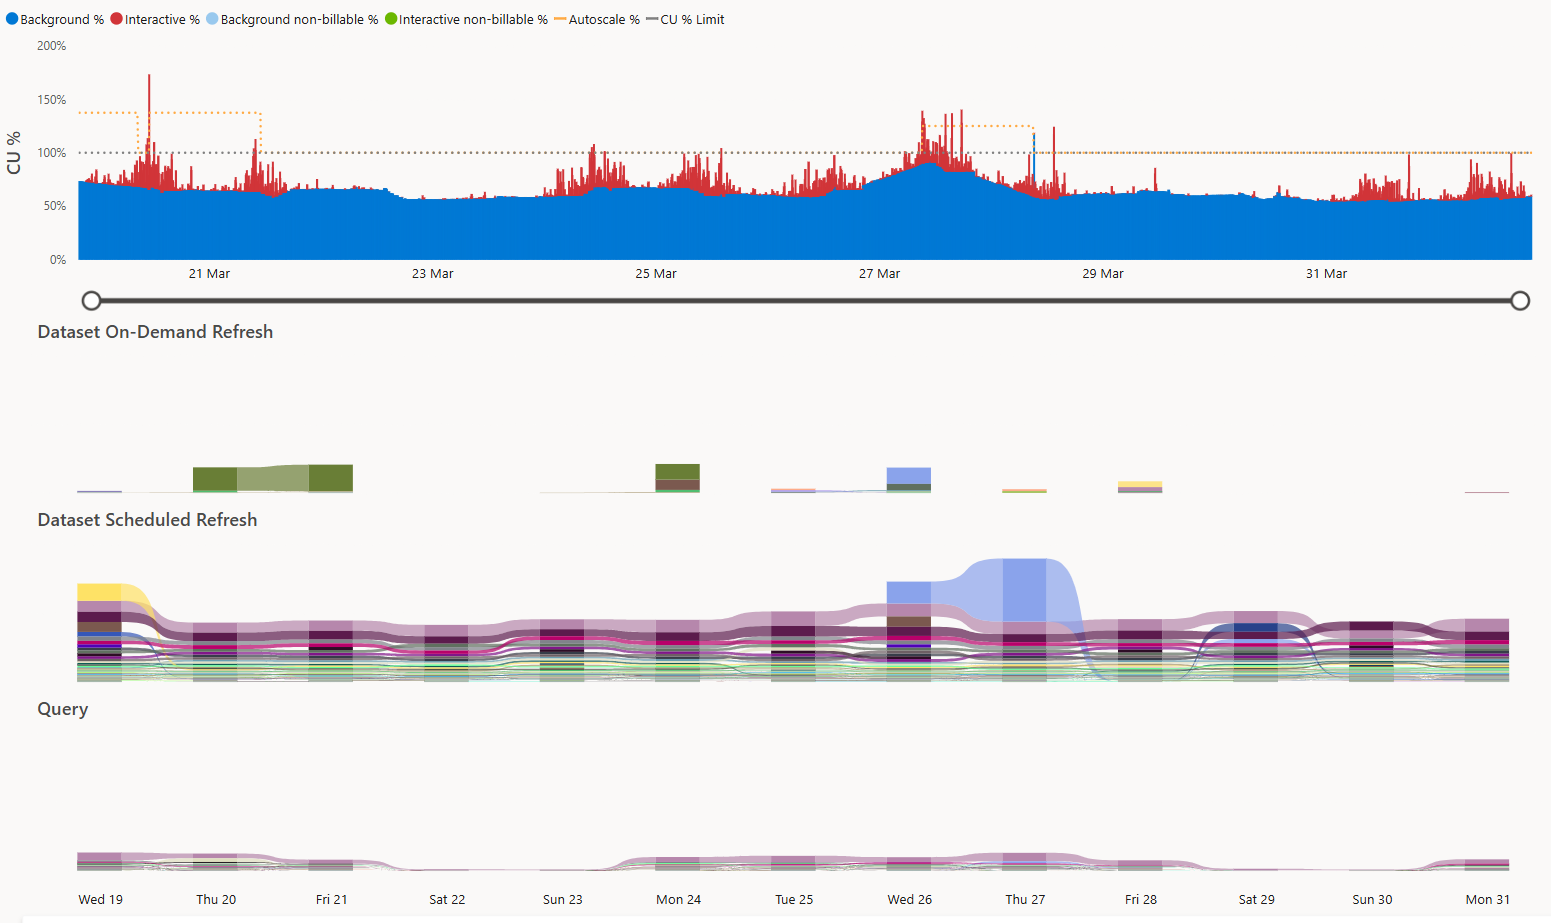
You are able to build custom Reports from the Semantic Model. I found the following view to provide the most value to me, helping pinpoint problematic Semantic Models. This visual uses Dates[Date], Items[WorkspaceName], Items[ItemName], MetricByItemandOperationandDay[Operation Name] and MetricByItemandOperationandDay[sum_CU].
Feature Usage and Adoption Report
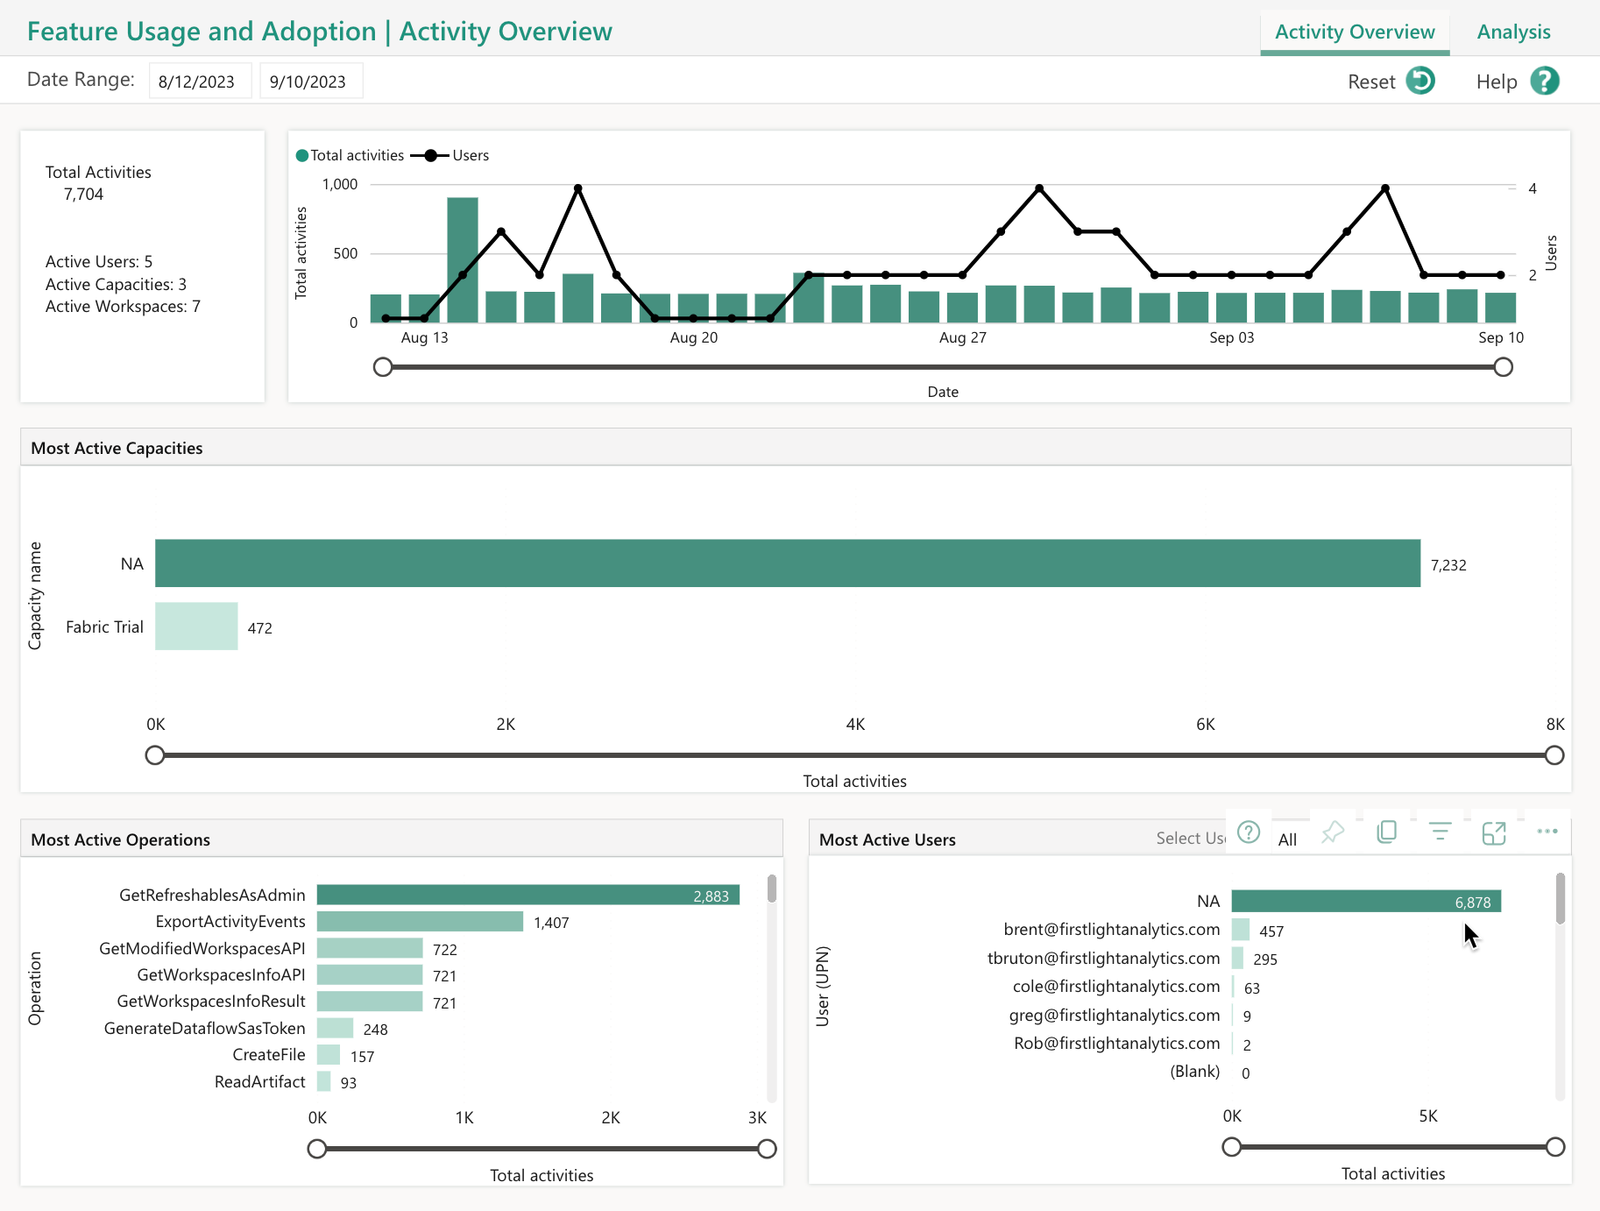
If you have the Fabric Administrator role you also have access to the Feature Usage and Adoption Report out of the box, in the Admin monitoring Workspace. This provides some basic reporting on usage and activities on the tenant. This provides data for the last 30 days.
Log Analytics Integration
Power BI has a integration with Log Analytics. This sends Analysis Services engine trace events, from connected Workspaces to Log Analytics.
Microsoft has provided the Fabric Log Analytics for Analysis Services Engine report template. This uses Execution Metrics Logs to provide reporting on CPU and duration metrics for operations performed by Semantic Models. Additionally Progress Report Logs are used to give addition details on Refreshes.
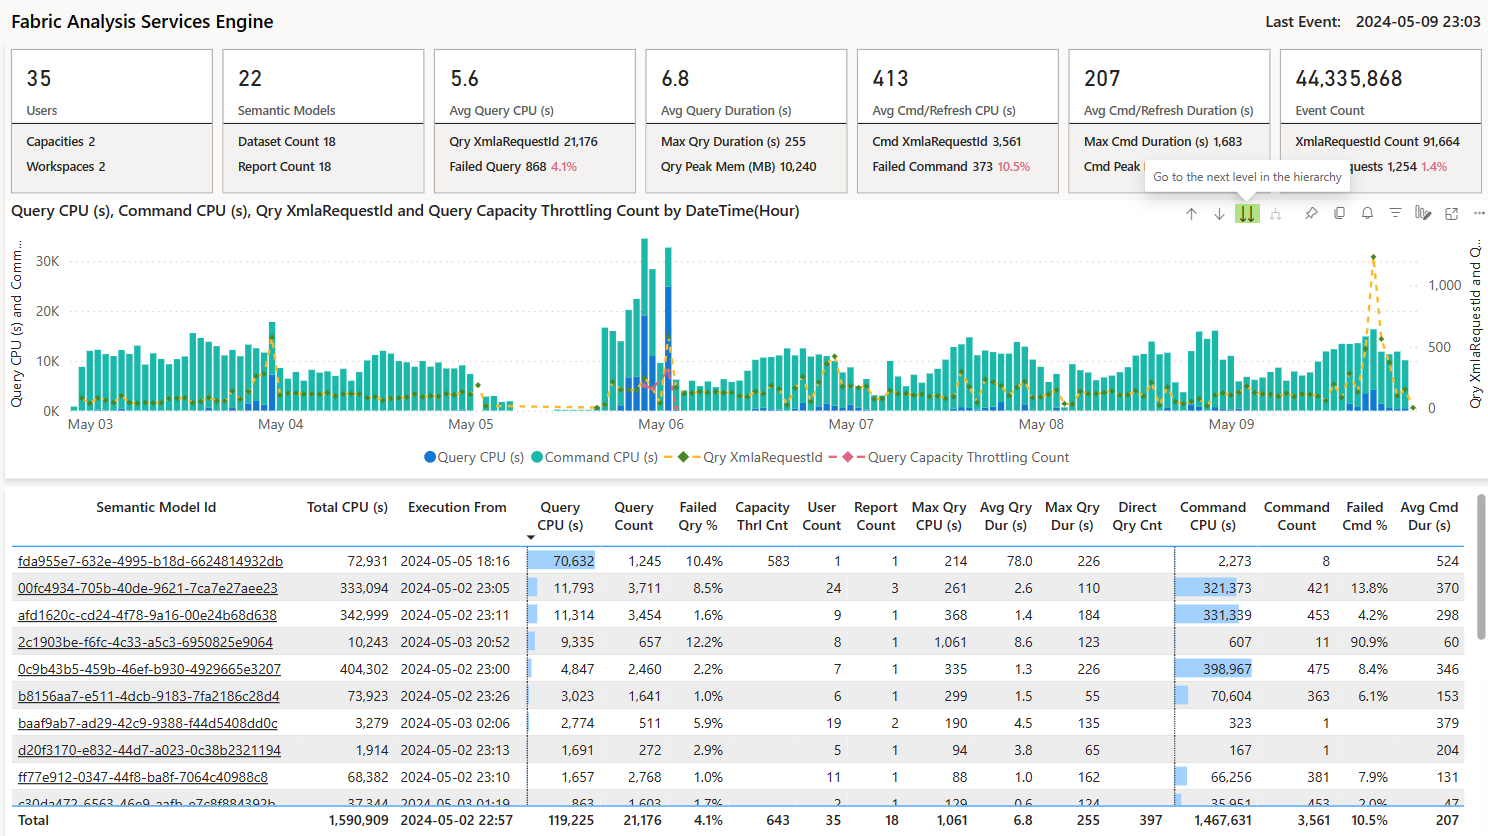 Fabric Log Analytics for Analysis Services Engine report template
This data is very useful for:
- Identifying expensive queries and refreshes
- Track and debug Refresh failures
- Track and trend errors
- Determine exact queries that resulted in errors for users
- Generate report usage metrics
Scanner APIs
Microsoft Docs: Run metadata scanning
With the scanner APIs, you can extract information such as item name, owner, sensitivity label, and endorsement status. For Power BI semantic models, you can also extract the metadata of some of the objects they contain, such as table and column names, measures, DAX expressions, mashup queries, and so forth. The metadata of these semantic model internal objects is referred to as subartifact metadata.
I have a previous post on using the Scanner APIs to extracting tenant metadata.
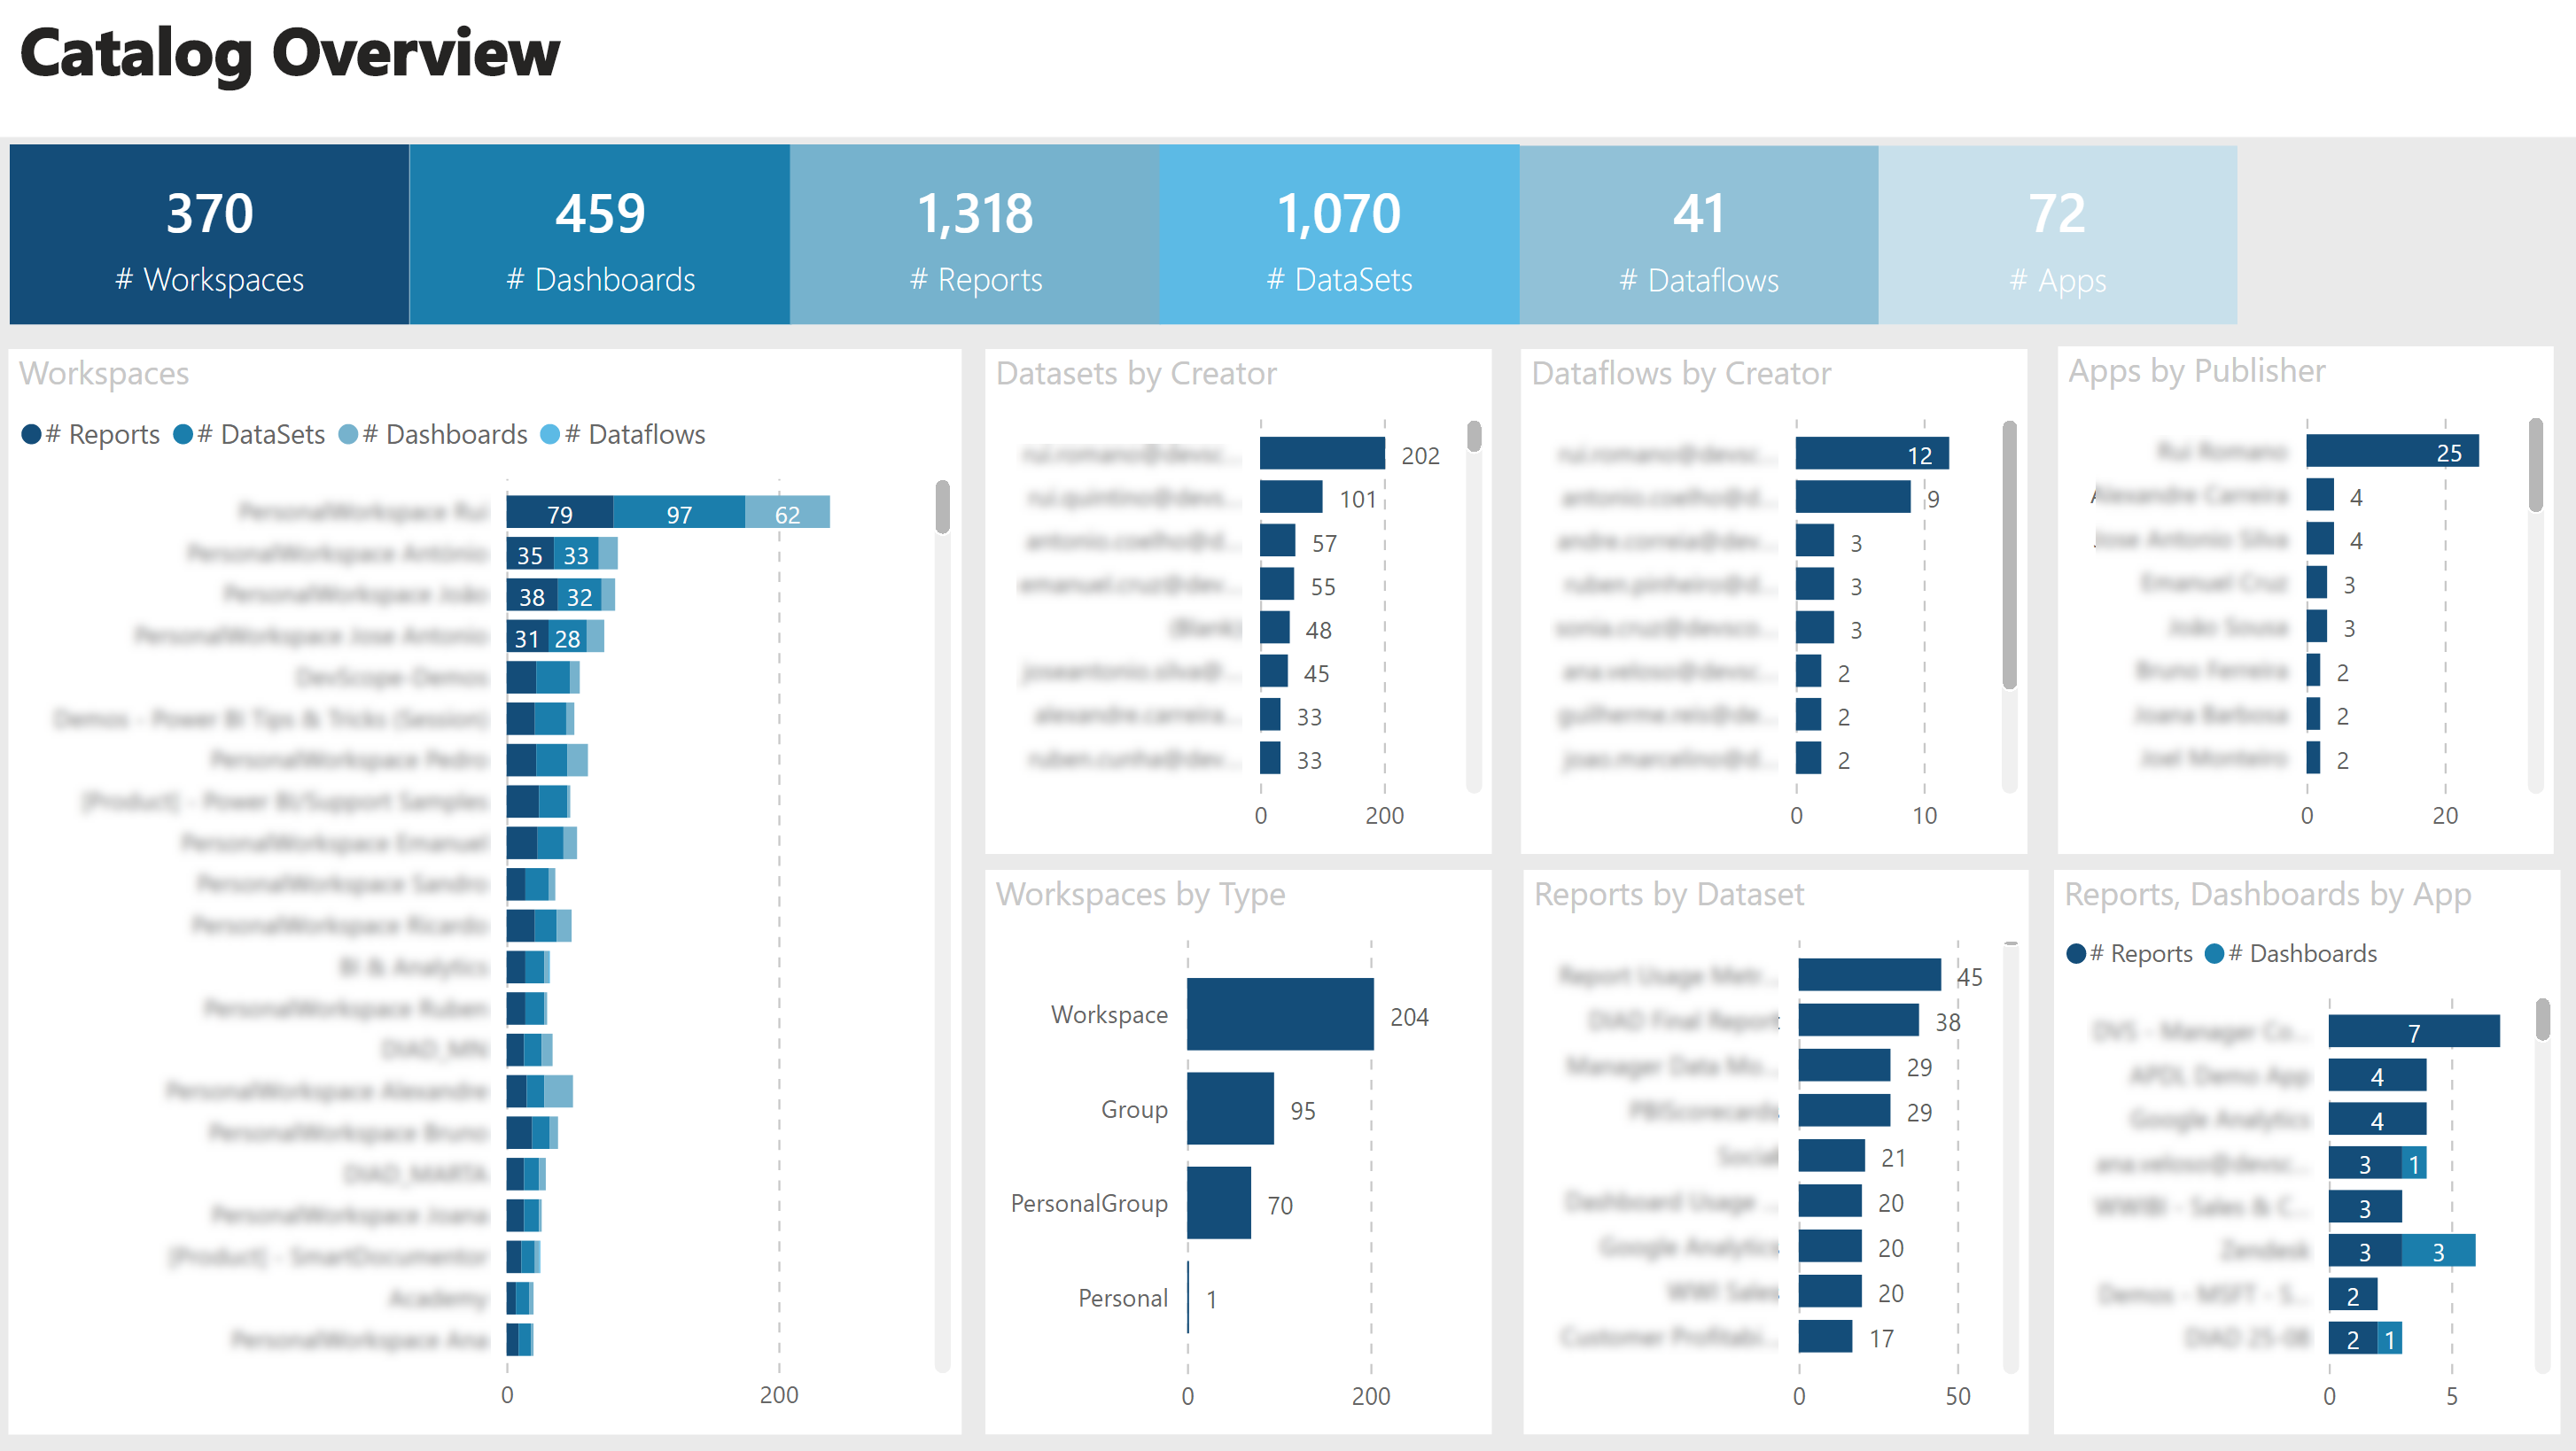
Rui Romano has a reporting solution, pbimonitor, that visuals that data as a catalogue for all Power BI assets.
Log Analytics Integration and Scanner APIs BFFs
The real power comes from combining the Log Analytics and Scanner APIs. Lets first look at the Scanner. We can define a Objects table, which is a union of Workspaces, Semantic Models and Reports, whose IDs are all captured in a single field objectId. Additionally it worth having datasetId against both Semantic Models and Reports, meaning for Reports, you can determine the upstream Semantic Model, and for Semantic Model, all the downstream Reports.
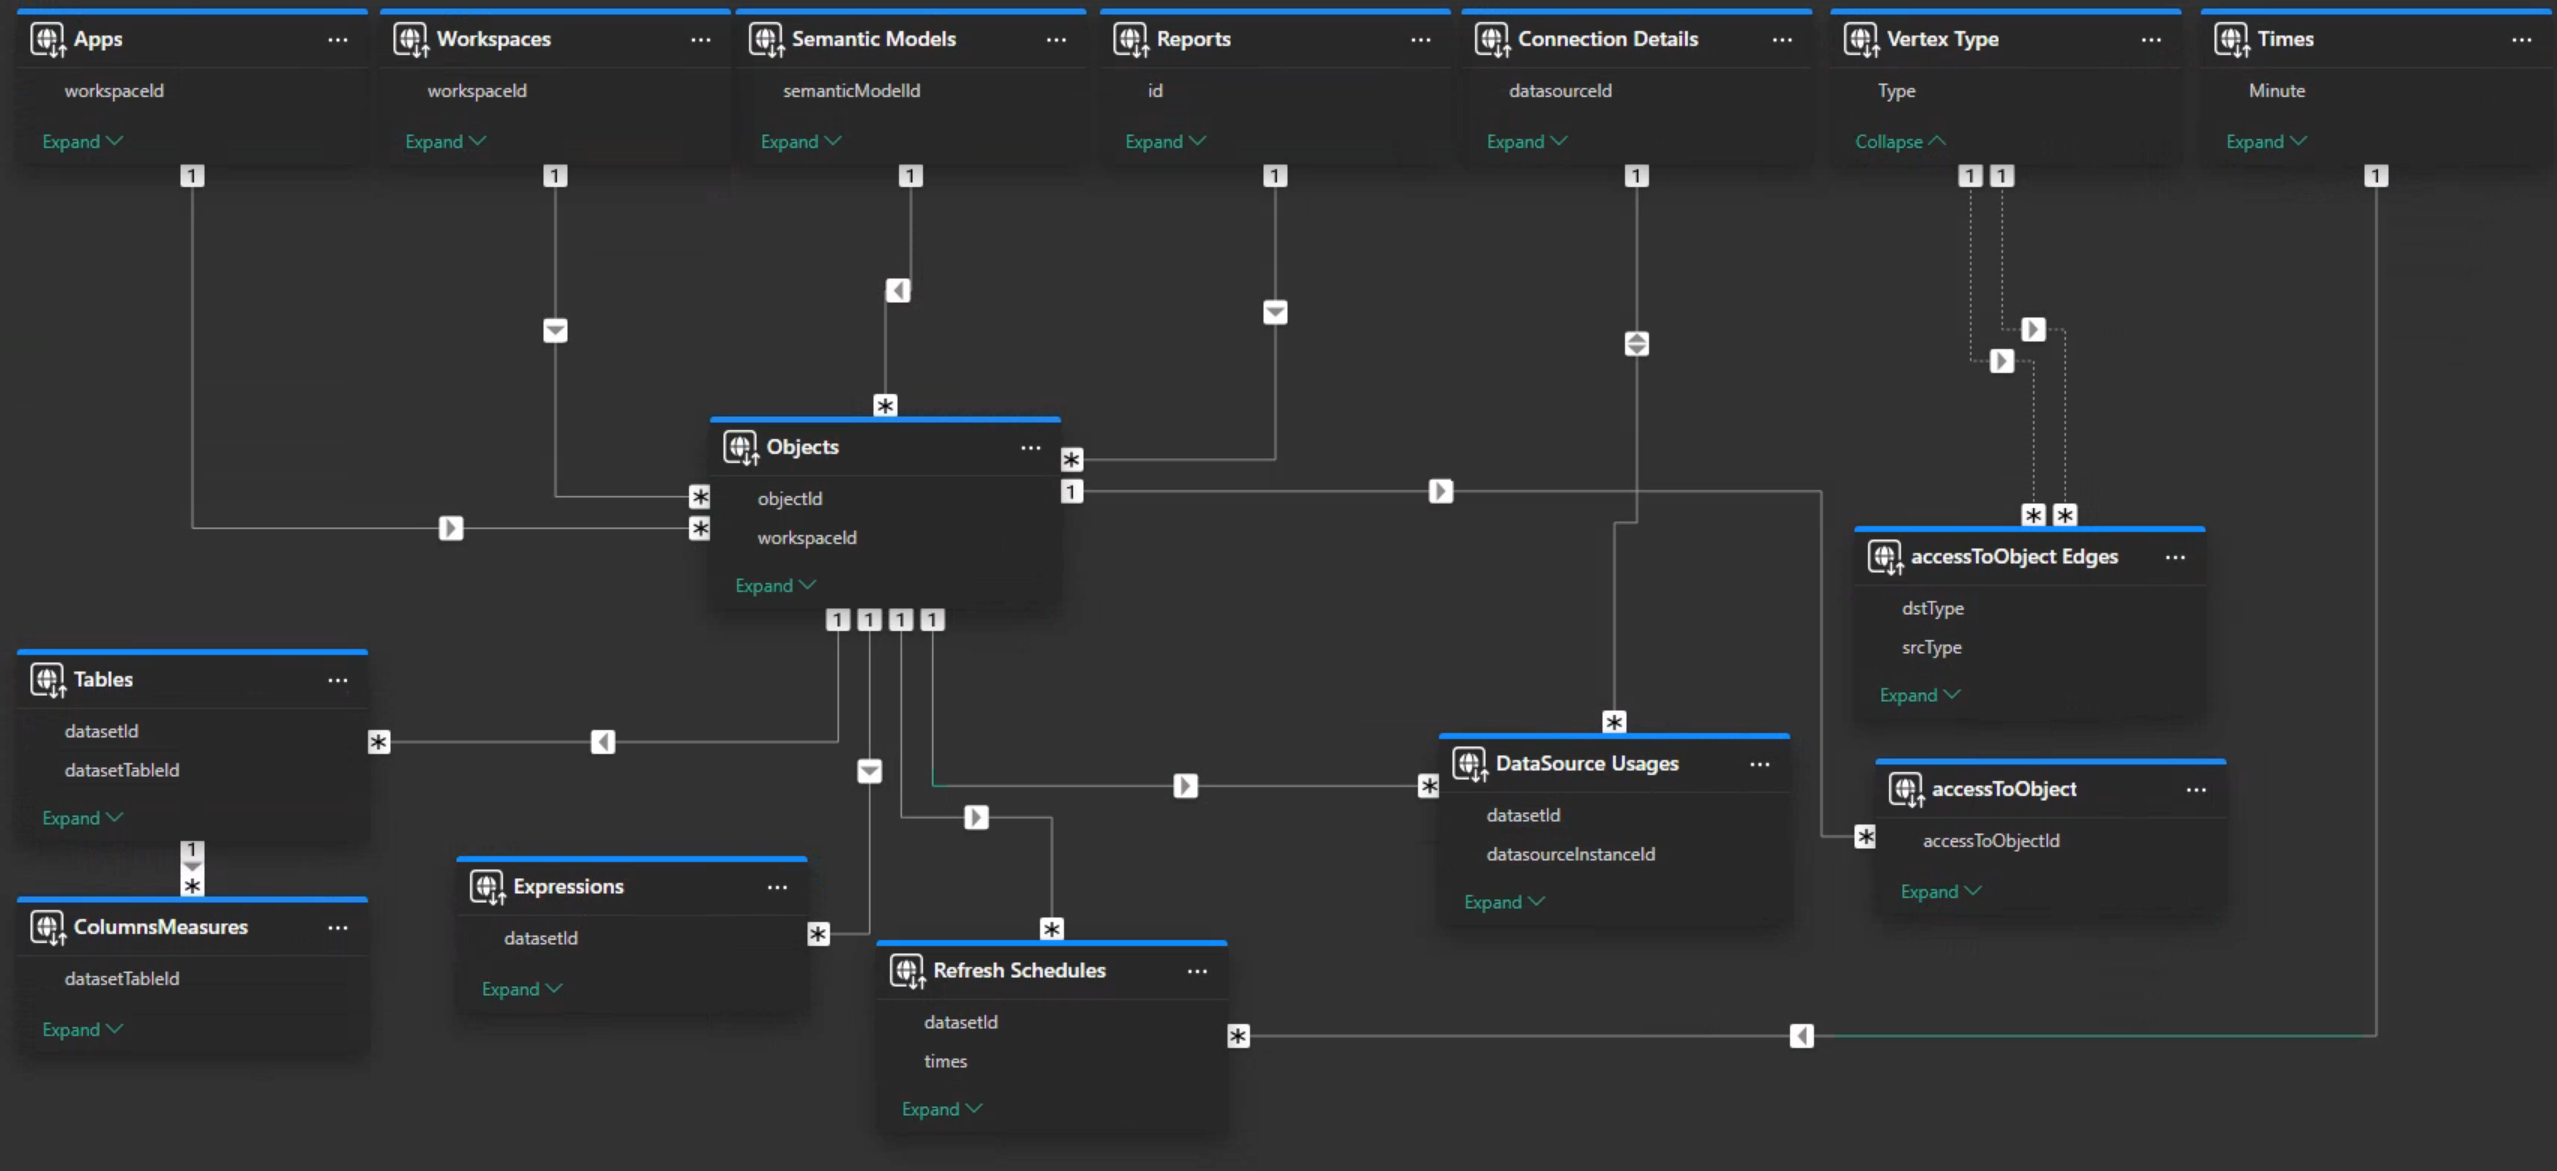
Log Analytics records Semantic Model server traces, so we can easily appended the data model from the Fabric Log Analytics for Analysis Services Engine report template. We connect it to the Objects table rather than to the Semantic Models dimension so it respects the filters from the other dimensions.
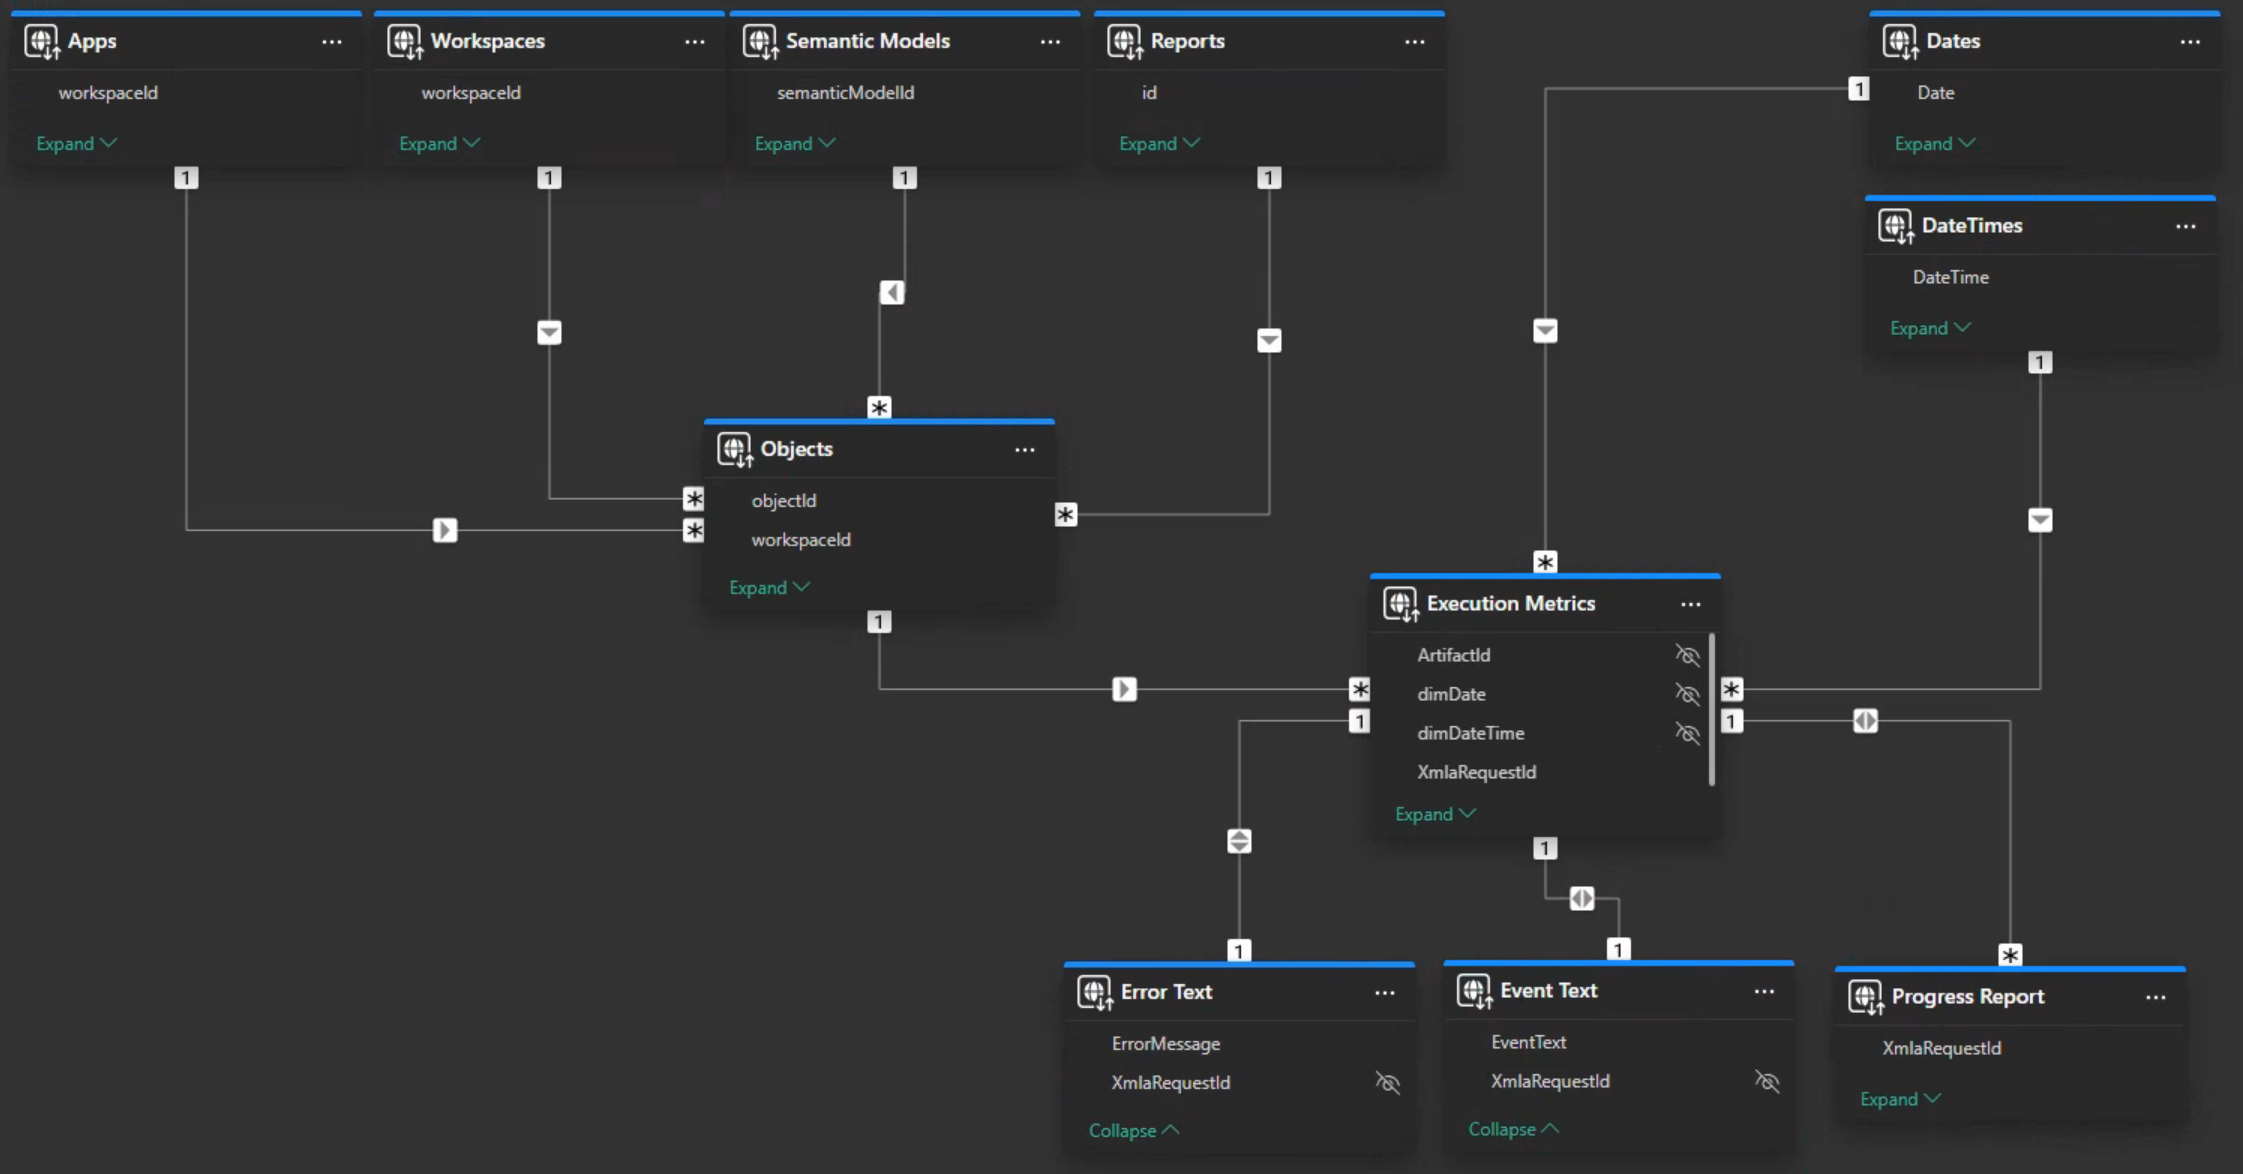
Now the Server Traces have been enriched you get some benefits. Firstly you can see items that have no traces, which means you can identify unused artifact that can be decommissioned. Secondly, the logs have reportId, with a report dimension you can provide the report name making the data more understandable.
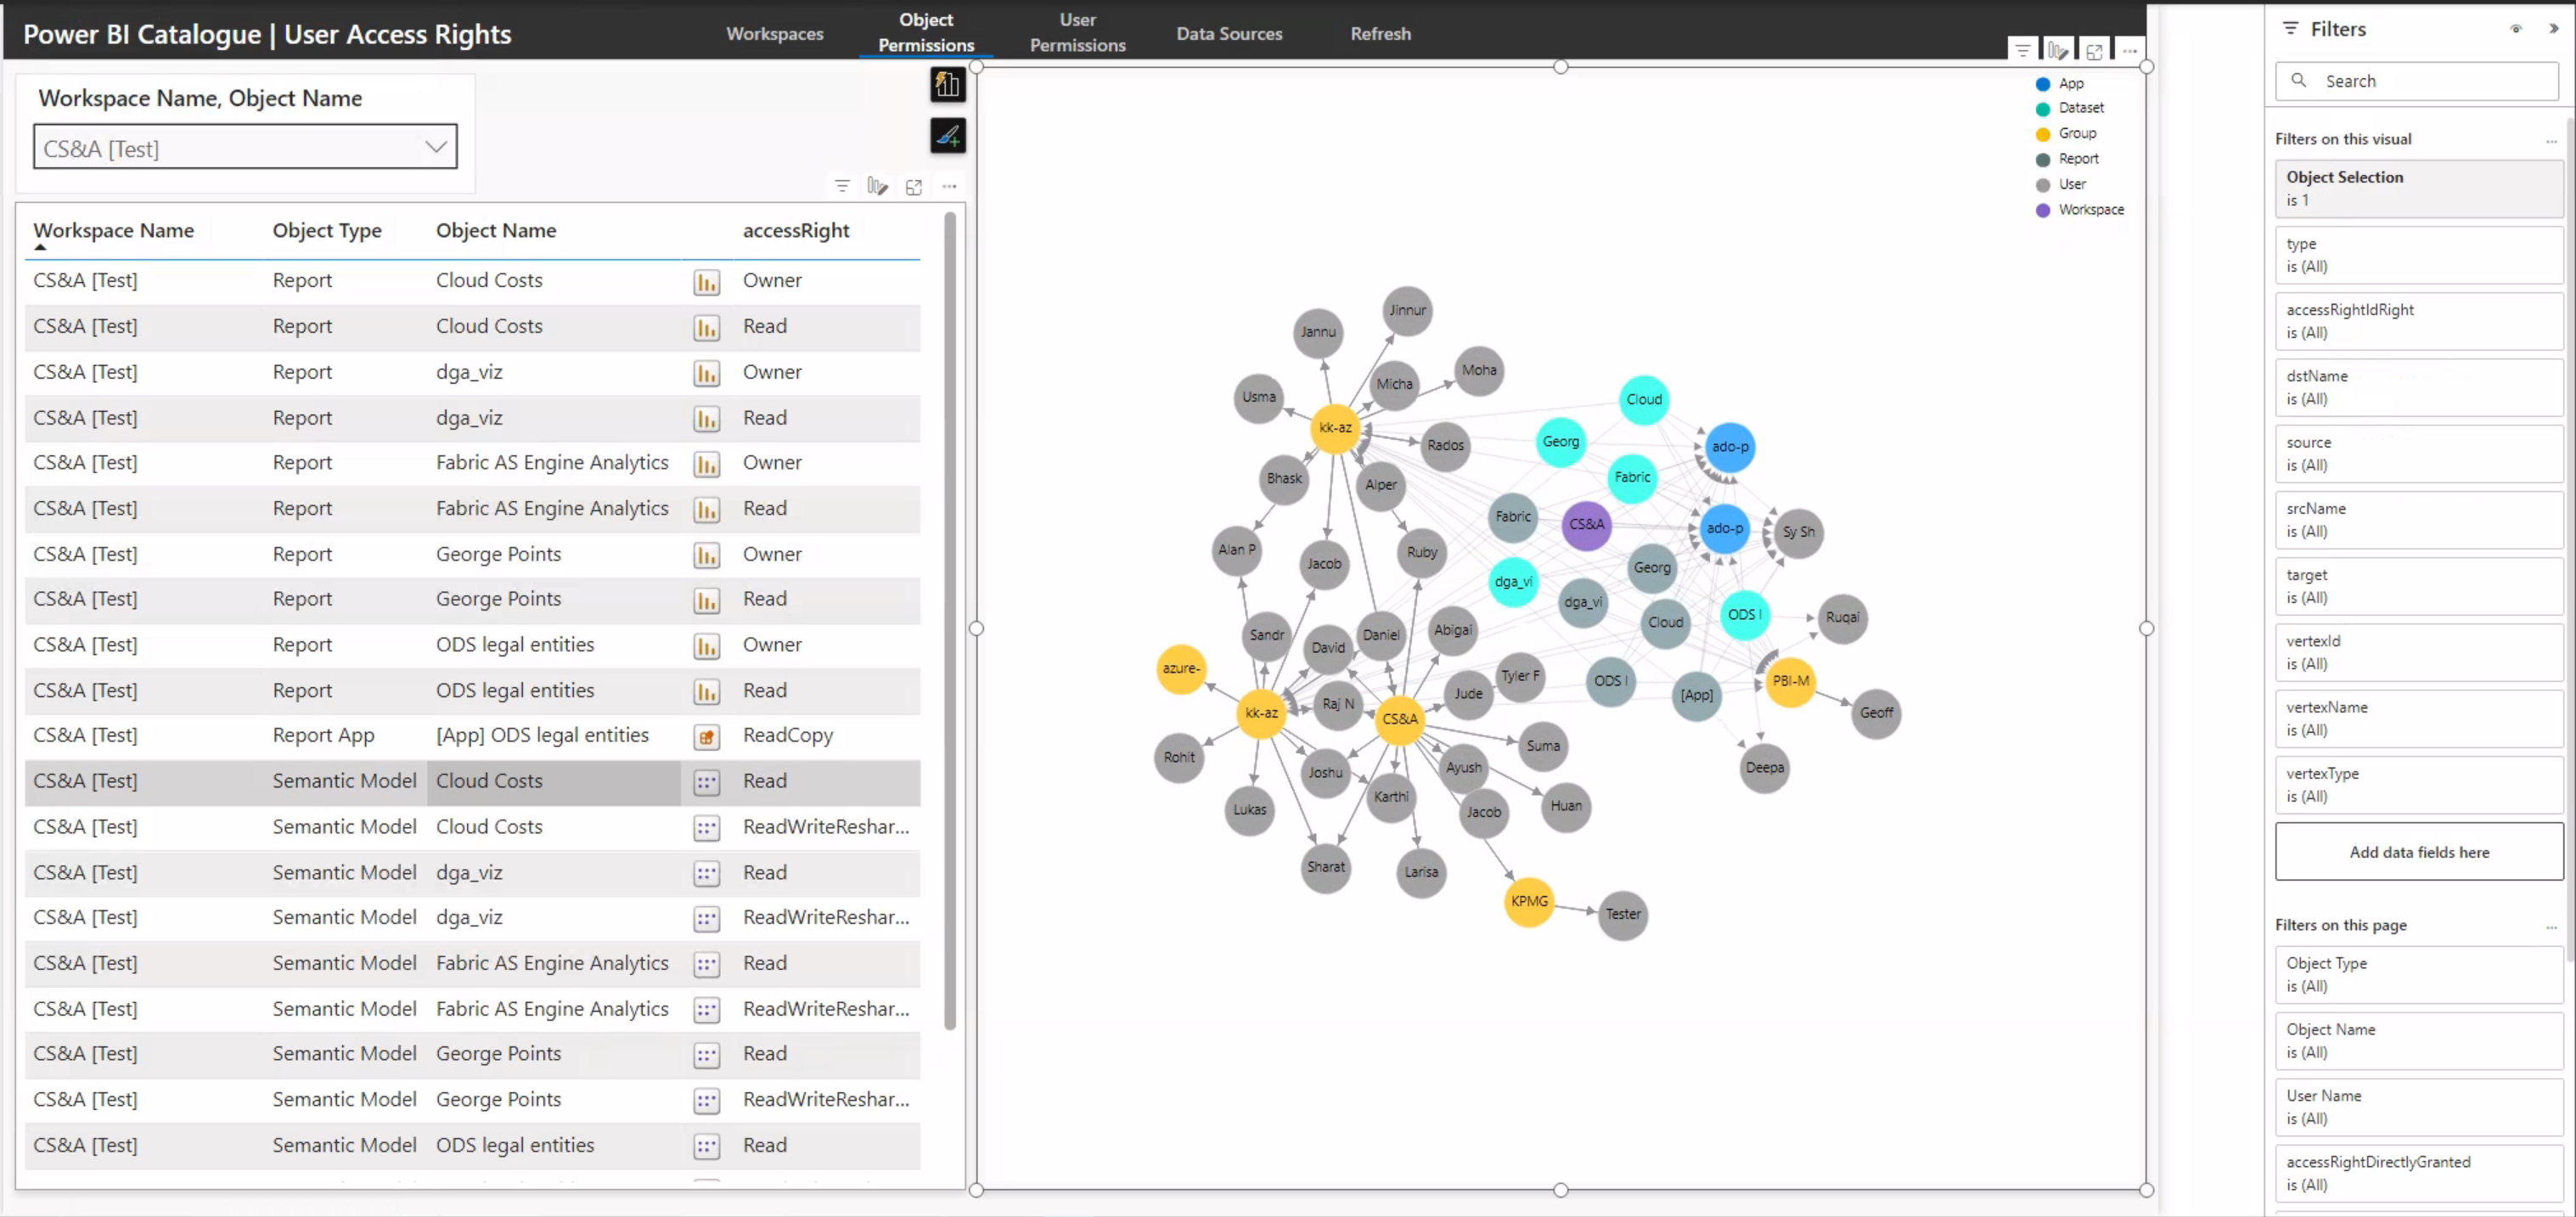
You can see in the Scanner ER diagram I have the accessToObjects and accessToObject Edges tables. These are from my previous posts on GraphFrames, and are used in a Deneb Force Direct graph. These allow you to know the exact permissions a specific user has on Workspace, Semantic Models etc, even if they inherit the permission through a long chain of User Groups. Additionally you can filter to a specific object and visually see what permissions are granted and by what path.
For me, the last piece of the puzzle, is to add a tenant wide Vertipaq Analyzer scan. If you have Fabric this is easy as you can run the DMVs with Sempy, as investigated in my previous post on Vertipaq Analyzer. I don't, and annoyingly the REST APIs don't support DMVs or DAX INFO functions. This could be a fantastic addition, allowing the identification of potential areas for optimizations, by comparing refresh times to Semantic Model sizes for example.
FUAM
If you have Fabric there is now another solution that is part of Microsoft's Fabric Toolbox: Fabric Unified Admin Monitoring (FUAM).
FUAM extracts the following data from the tenant and stores it in a lakehouse:
- Tenant Settings
- Delegated Tenant Settings
- Activities
- Workspaces
- Capacities
- Capacity Metrics
- Tenant meta data (Scanner API)
- Capacity Refreshables
- Git Connections
It calls a large number of Power BI and Fabrics APIs, including the the Activity, and Scanner APIs. It also gets CU usage data from the Fabric Capacity Metrics App. Interestingly it also runs Semantic Links Labs Vertipaq Analyzer to get sizes or Semantic Models tables, columns etc.
If you have Fabric and need some quick information this could be a fantastic start. It does lack the Server Traces, but if you setup the Log Analytics integration you can still report on this separately with the template mentioned above.