DaxLib.SVG
DaxLib.SVG v0.2.0-beta release
I am happy to announce the release of DaxLib.SVG v0.2.0-beta, designed to help make creating SVGs in Power BI easier for everyone.
What are SVGs?
SVGs are Vector images and defined using XML. You can define elements like <circle>, <path>, <rect> which are rendered into images.
For example you can define a simple circle like this:
<svg width='500' height='100' viewbox= '0 0 100 20' xmlns='http://www.w3.org/2000/svg'>
    <circle cx='50' cy='10' r='10%' fill='#EC008C' fill-opacity='0.5' stroke='#EC008C' stroke-width='1'/>
</svg>
Intro to SVGs
If you want to know more about SVGs, Joshua Comeau has a fantastic blog post on SVGs: A Friendly Introduction to SVG
DaxLib.SVG Function Categories
DaxLib.SVG has the following function categories:
-
Wraps one or more
Elements,Defs,Compounds, applying required metadata and<SVG>tags -
SVG primitives (i.e.
<Rect>,<Circle>,<line>) -
Complex
Compoundcomponents (i.e. boxplot, violin) made fromElements -
Define reusable SVG elements (i.e.
<linearGradient>,<clipPath>, and shapes). -
Create Attributes (i.e.fill, stroke, opacity) string that can applied to
ElementsandDefs -
Create Transform strings
-
Mapping values between scales
-
Themes and functions for colour manipulation.
How do I use DaxLib.SVG?
For detailed examples and complete API reference, check out the documentation site or download the example PBIP file. But lets have a quick tour of what DaxLib.SVG offers.
Data Category
Any measures or column that use these UDFs must have DataCategory = "ImageUrl", otherwise you will see a string output instead of the image.
SVG Wrapper
DaxLib.SVG.SVG() is a wrapper function. This wraps daxlib.svg.Element.*, daxlib.svg.Compound.* and daxlib.svg.Def.* with <SVG> tags plus the metadata Power BI need to interpret the SVG definition correctly (data:image/svg+xml;utf8)
| Name | Type | Required | Description |
|---|---|---|---|
| width | STRING | Width (pixels or percentage) | |
| height | STRING | Height (pixels or percentage) | |
| viewbox | STRING | viewBox (e.g., "0 0 100 100") | |
| contents | STRING | SVG elements to include (e.g., from DaxLib.SVG.Element functions) | |
| sortValue | EXPR | Sort value for ordering in tables |
STRING SVG string
function 'DaxLib.SVG.SVG' =
    (
        width : STRING,
        height : STRING,
        viewbox : STRING,
        contents : STRING,
        sortValue : EXPR
    ) =>

        VAR _Canvas =   IF( NOT ISBLANK( width ) && NOT ISBLANK( height ), "width='" & width & "' height='" & height & "' " )
        VAR _SortDesc = IF( NOT ISBLANK( sortValue ), "<desc>" & FORMAT( sortValue, "000000000000" ) & "</desc>" )

        RETURN

            "data:image/svg+xml;utf8," &
            "<svg " &
            _Canvas &
            viewbox &
            "xmlns='http://www.w3.org/2000/svg'>" &
            _SortDesc &
            contents &
            "</svg>"
Elements
These functions generate SVG primitives such as <circle>, <rect>, <line>, <polygon>, <polyline>, <text>, and <<g>. Use these together to build more complex SVG graphics.
For example we can use DaxLib.SVG.Element.Circle() to draw the circle above in Power BI like this:
DaxLib.SVG.SVG(
    500,                // width
    100,                // height
    "0 0 100 20",       // viewbox
    DaxLib.SVG.Element.Circle(
        50,             // cx
        10,             // cy
        "10%",          // r
        DaxLib.SVG.Attr.Shapes(
            DaxLib.SVG.Colour.Theme(
                "Power BI",
                25
            ),              // fill
            0.5,            // fillOpacity
            BLANK(),        // fillRule
            DaxLib.SVG.Colour.Theme(
                "Power BI",
                25
            ),              // stroke
            1,              // strokeWidth
            BLANK(),        // strokeOpacity
            BLANK()         // opacity
        ),              // attributes
        BLANK()         // transforms
    ),                  // contents
    BLANK()             // sortValue
)
| Name | Type | Required | Description |
|---|---|---|---|
| cx | STRING | The x position of the center | |
| cy | STRING | The y position of the center | |
| r | STRING | The radius | |
| attributes | STRING | Direct SVG attributes to apply (e.g., "fill='red' stroke-width='2'"), can generate with DaxLib.SVG.Attr.* or manually |
|
| transforms | STRING | Transformation to apply (can be generated with DaxLib.SVG.Transforms) |
STRING <circle> element
function 'DaxLib.SVG.Element.Circle' =
    (
        cx: STRING,
        cy: STRING,
        r: STRING,
        attributes: STRING,
        transforms: STRING
    ) =>

        "<circle" &
        " cx='" & cx & "'" &
        " cy='" & cy & "'" &
        " r='" & r & "'" &
        IF( NOT ISBLANK( attributes ), " " & attributes & " " ) &
        IF( NOT ISBLANK( transforms ), " transform='" & transforms & "'" ) &
        "/>"
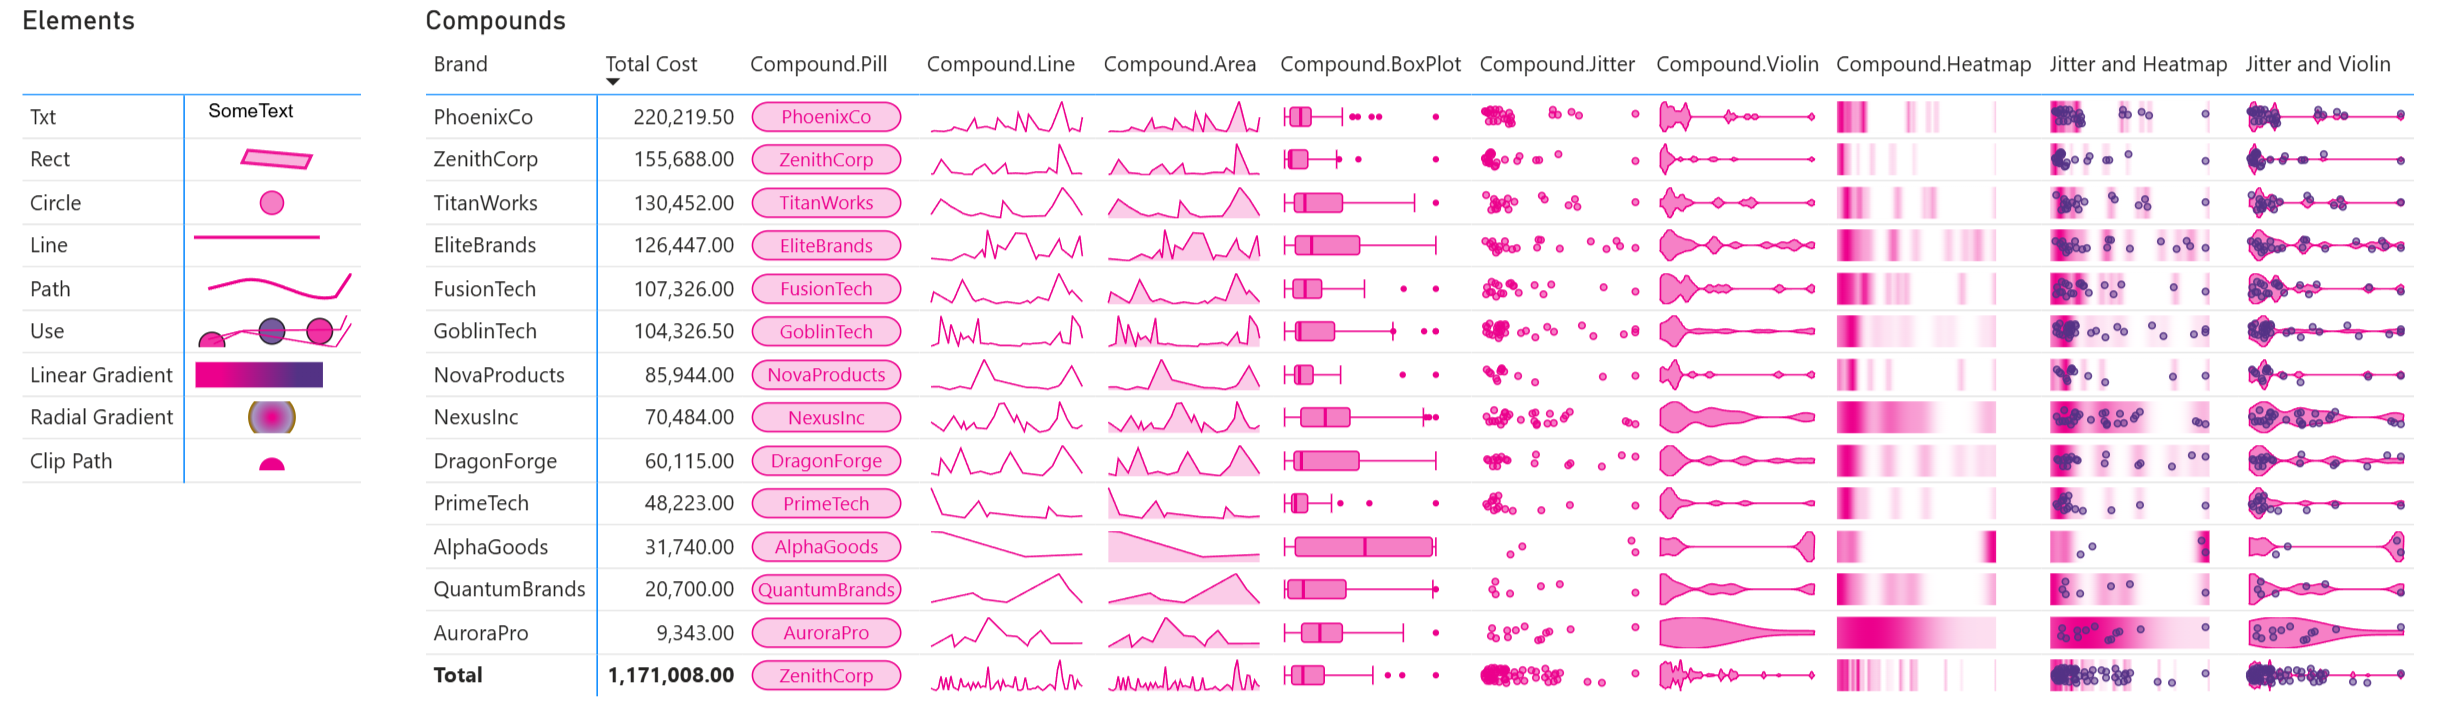
Compounds
Compound functions combine multiple DaxLib.SVG.Element.* functions into higher-level reusable comcponents and complete chart visualizations. These simplify the creation of complex visuals by providing ready-made chart types.
Each compound function accepts x, y, width, and height parameters, making it easy to combine multiple compounds together or mix them with basic elements. Here is how to create a violin plot.
DaxLib.SVG.SVG(
    500,
    100,
    BLANK(),
    DaxLib.SVG.Compound.Violin(
        0,                  // x
        0,                  // y
        500,                // width
        100,                // height
        0.05,               // paddingX
        0.02,               // paddingY
        Dates[Date],        // axisRef
        [Total Cost],       // measureVal
        MAX( Samples[Samples] ), // samples
        MAX( Bandwidth[Bandwidth] ), // bandwidth
        DaxLib.SVG.Colour.Theme(
            "Power BI",
            25
        )                   // color
    ),
    BLANK()
)
DaxLib.SVG.Compound.Violin( x, y, width, height, paddingX, paddingY, axisRef, measureRef, samples, bandwidth, color )
| Parameter | Type | Required | Description |
|---|---|---|---|
| x | INT64 | The x position of the compound | |
| y | INT64 | The y position of the compound | |
| width | INT64 | The width of the compound | |
| height | INT64 | The height of the compound | |
| paddingX | DOUBLE | The horizontal padding percentage (0.0-1.0, e.g., 0.1 = 10% padding) | |
| paddingY | DOUBLE | The vertical padding percentage (0.0-1.0, e.g., 0.1 = 10% padding) | |
| axisRef | ANYREF EXPR | The column that the measure will be evaluated against | |
| measureRef | NUMERIC EXPR | The measure to evaluate | |
| samples | INT64 | Number of density calculation points | |
| bandwidth | NUMERIC | Kernel bandwidth for smoothing | |
| color | STRING | Fill color for the violin shape |
STRING An SVG violin plot showing the probability density of data using kernel density estimation
function 'DaxLib.SVG.Compound.Violin' =
    (
        x: INT64,
        y: INT64,
        width: INT64,
        height: INT64,
        paddingX: DOUBLE,
        paddingY: DOUBLE,
        axisRef: ANYREF EXPR,
        measureRef: NUMERIC EXPR,
        samples: INT64,
        bandwidth: NUMERIC,
        color: STRING
    ) =>

        // Apply padding to dimensions
        VAR _X =            x + (width * (IF(ISBLANK(paddingX), 0, paddingX) / 2))
        VAR _Y =            y + (height * (IF(ISBLANK(paddingY), 0, paddingY) / 2))
        VAR _Width =        width * (1 - IF(ISBLANK(paddingX), 0, paddingX))
        VAR _Height =       height * (1 - IF(ISBLANK(paddingY), 0, paddingY))

        // Check if Axis is numeric
        VAR axisSample =    MAX( axisRef )
        VAR axisIsNumeric = ISNUMERIC( axisSample ) || ISDATETIME( axisSample )

        // For totals
        VAR _Data =
            ADDCOLUMNS(
                FILTER(
                    VALUES( axisRef ),
                    NOT ISBLANK( measureRef )
                ),
                "@AxisIndex",
                    IF(
                        axisIsNumeric,
                        axisRef,
                        RANK( DENSE, CALCULATETABLE( VALUES( axisRef ), ALLSELECTED() ) )
                    ),
                "@Value", measureRef
            )

        VAR _NumValues =        COUNTROWS( _Data )
        VAR _Min =              MINX( _Data, [@Value] )
        VAR _Max =              MAXX( _Data, [@Value] )
        VAR _Range =            _Max - _Min
        VAR _RangePerSample =   _Range / samples

        // Calculate Kernel Density Estimation using Normal distribution
        VAR _KDE =
            ADDCOLUMNS(
                GENERATESERIES( 0, samples + 1, 1 ),
                "@InputX", _Min + _RangePerSample * [Value],
                "@KDE",
                    ( 1 / _NumValues ) *
                    SUMX(
                        _Data,
                        NORM.DIST(
                            _Min + _RangePerSample * [Value],
                            [@Value],
                            bandwidth,
                            FALSE
                        )
                    )
            )

        VAR _MaxKDE =       MAXX( _KDE, [@KDE] )

        // Map KDE values to SVG coordinates using normalize function
        VAR _Points =
            ADDCOLUMNS(
                _KDE,
                "@X", DaxLib.SVG.Scale.Normalize( [@InputX], _Min, _Max, _X, _X + _Width),
                "@Y", DaxLib.SVG.Scale.Normalize( [@KDE], 0, _MaxKDE, _Y + _Height * 0.5, _Y )
            )

        // Create control points for smooth Bézier curves
        VAR _PointsWithPrev =
            NATURALLEFTOUTERJOIN(
                _Points,
                SELECTCOLUMNS(
                    _Points,
                    "Value", [Value] + 1,
                    "@PrevX", [@X],
                    "@PrevY", [@Y]
                )
            )

        VAR _WithControlPoints =
            ADDCOLUMNS(
                _PointsWithPrev,
                "@CX", [@prevX] + ( ( [@x] - [@prevX] ) / 2 ),
                "@CY", [@y]
            )

        // Create the violin shape as a single closed path
        // Start at the center-left, go up the top curve, then down the bottom curve, and close
        VAR _FirstPoint = MINX( _Points, [@X] )
        VAR _LastPoint = MAXX( _Points, [@X] )
        VAR _CenterY = _Y + (_Height * 0.5)

        // Top half curve (from left to right)
        VAR _TopCurve =
            CONCATENATEX(
                _WithControlPoints,
                IF(
                    [Value] = 0,
                    "M " & [@X] & " " & _CenterY & " L " & [@X] & " " & [@Y],
                    "S " & [@CX] & " " & [@CY] & ", " & [@X] & " " & [@Y]
                ),
                " ",
                [Value],
                ASC
            )

        // Bottom half curve (from right to left, mirrored)
        VAR _BottomCurve =
            CONCATENATEX(
                _WithControlPoints,
                VAR _MirroredY = _CenterY + (_CenterY - [@Y])
                VAR _MirroredCY = _CenterY + (_CenterY - [@CY])
                RETURN
                    "S " & [@CX] & " " & _MirroredCY & ", " & [@X] & " " & _MirroredY,
                " ",
                [Value],
                DESC
            )

        // Create a single closed path for the violin shape
        VAR _ViolinPath =
            _TopCurve &
            " " & _BottomCurve &
            " Z" // Close the path

        // Combined Elements
        VAR _CombinedElements =
            DaxLib.SVG.Element.Paths(
                _ViolinPath, // d
                DaxLib.SVG.Attr.Shapes(
                    color,          // fill
                    0.5,            // fillOpacity
                    BLANK(),        // fillRule
                    color,          // stroke
                    1,              // strokeWidth
                    BLANK(),        // strokeOpacity
                    BLANK()         // opacity
                ),
                BLANK()             // transforms
            )

        RETURN

            IF( NOT ISEMPTY( _Data ), _CombinedElements )
Defs
Defs functions allow you to define reusable SVG elements that can be referenced multiple times throughout your visual.
Defining Defs
DaxLib.SVG.Def.* should be wrapped in DaxLib.SVG.Element.Defs()] to add <defs>...</defs> tags.
SVG Performance
Using Defs can reduce the string length of the SVG reducing the chance of hitting memory errors in Power BI Minimizing SVG Strings to Avoid Hitting Power BI Memory Limits
We can define a linear gradient to be applied to a rect.
DaxLib.SVG.SVG(
    500,
    100,
    "0 0 100 20",
    DaxLib.SVG.Element.Defs(
        DaxLib.SVG.Def.LinearGradient(
            "myGradient",   // id
            DaxLib.SVG.Def.GradientStop(
                "20%",      // offset
                DaxLib.SVG.Colour.Theme(
                    "Power BI",
                    25
                ),          // colour
                BLANK()     // opacity
            ) &
            DaxLib.SVG.Def.GradientStop(
                "80%",      // offset
                DaxLib.SVG.Colour.Theme(
                    "Power BI",
                    26
                ),           // colour
                BLANK()     // opacity
            ),              // stops
            BLANK(),        // x1
            BLANK(),        // y1
            BLANK(),        // x2
            BLANK()         // y2
        )                   // contents
    ) &
    DaxLib.SVG.Element.Rect(
        2,                  // x
        2,                  // y
        "80%",              // width
        "80%",              // height
        BLANK(),            // rx
        BLANK(),            // ry
        DaxLib.SVG.Attr.Shapes(
            "url(""" & "#myGradient" & """)", // fill
            BLANK(),        // fillOpacity
            BLANK(),        // fillRule
            BLANK(),        // stroke
            BLANK(),        // strokeWidth
            BLANK(),        // strokeOpacity
            BLANK()         // opacity
        ),                  // attributes
        BLANK()             // transforms
    ),
    BLANK()                 // sortValue
)
| Name | Type | Required | Description |
|---|---|---|---|
| defId | STRING | The unique identifier for the gradient | |
| stops | STRING | Concatenated list of one or more DaxLib.SVG.Def.GradientStop elements |
|
| x1 | STRING | Start X position | |
| y1 | STRING | Start Y position | |
| x2 | STRING | End X position | |
| y2 | STRING | End Y position |
STRING <linearGradient> definition
function 'DaxLib.SVG.Def.LinearGradient' =
    (
        defId: STRING,
        stops: STRING,
        x1: STRING,
        y1: STRING,
        x2: STRING,
        y2: STRING
    ) =>

        "<linearGradient" &
        " id='" & defId & "'" &
        IF( NOT ISBLANK( x1 ), " x1='" & x1 & "'" ) &
        IF( NOT ISBLANK( y1 ), " y1='" & y1 & "'" ) &
        IF( NOT ISBLANK( x2 ), " x2='" & x2 & "'" ) &
        IF( NOT ISBLANK( y2 ), " y2='" & y2 & "'" ) &
        ">" &
        stops &
        "</linearGradient>"
Attributes
Attr functions generate attribute strings for fill, stroke, opacity, and text formatting. These wrappers ensure consistent attribute application across your SVG elements.
DaxLib.SVG.SVG(
    500,                // width
    100,                // height
    "0 0 100 20",       // viewbox
    DaxLib.SVG.Element.Circle(
        50,             // cx
        10,             // cy
        "10%",          // r
        DaxLib.SVG.Attr.Shapes(
            DaxLib.SVG.Colour.Theme(
                "Power BI",
                25
            ),              // fill
            0.5,            // fillOpacity
            BLANK(),        // fillRule
            DaxLib.SVG.Colour.Theme(
                "Power BI",
                25
            ),              // stroke
            1,              // strokeWidth
            BLANK(),        // strokeOpacity
            BLANK()         // opacity
        ),              // attributes
        BLANK()         // transforms
    ),                  // contents
    BLANK()             // sortValue
)
| Parameter | Type | Required | Description |
|---|---|---|---|
| fill | STRING | Fill color (e.g., "#FF0000", "red") | |
| fillOpacity | DOUBLE | Fill opacity value between 0 and 1 | |
| fillRule | STRING | Fill rule ("nonzero", "evenodd") | |
| stroke | STRING | Stroke color (e.g., "#000000", "black") | |
| strokeWidth | INT64 | Width of the stroke | |
| strokeOpacity | DOUBLE | Stroke opacity value between 0 and 1 | |
| opacity | DOUBLE | Overall opacity value between 0 and 1 |
STRING An attribute string that can be used directly in SVG elements
function 'DaxLib.SVG.Attr.Shapes' =
    (
        fill: STRING,
        fillOpacity: DOUBLE,
        fillRule: STRING,
        stroke: STRING,
        strokeWidth: INT64,
        strokeOpacity: DOUBLE,
        opacity: DOUBLE
    ) =>

        IF( NOT ISBLANK( fill ),          "fill='" & fill & "' ") &
        IF( NOT ISBLANK( fillOpacity ),   "fill-opacity='" & fillOpacity & "' ") &
        IF( NOT ISBLANK( fillRule ),      "fill-rule='" & fillRule & "' ") &
        IF( NOT ISBLANK( stroke ),        "stroke='" & stroke & "' ") &
        IF( NOT ISBLANK( strokeWidth ),   "stroke-width='" & strokeWidth & "' ") &
        IF( NOT ISBLANK( strokeOpacity ), "stroke-opacity='" & strokeOpacity & "' ") &
        IF( NOT ISBLANK( opacity ),       "opacity='" & opacity & "' ")
Transforms
Transform functions help you create transformation strings for rotating, scaling, translating, and skewing SVG elements. Like rotating this rect.
DaxLib.SVG.SVG(
    100,                // width
    20,                 // height
    BLANK(),            // viewbox
    DaxLib.SVG.Element.Rect(
        "50%",          // x
        "0%",           // y
        "40%",          // width
        8,              // height
        blank(),        // rx
        blank(),        // ry
        DaxLib.SVG.Attr.Shapes(
            DaxLib.SVG.Colour.Theme(
                MAX( Theme[Theme] ),
                MIN( Variant[Variant] )
            ),          // fill
            0.3,        // fillOpacity
            BLANK(),    // fillRule
            DaxLib.SVG.Colour.Theme(
                MAX( Theme[Theme] ),
                MIN( Variant[Variant] )
            ),          // stroke
            2,          // strokeWidth
            0.9,        // strokeOpacity
            BLANK()     // opacity
        ),              // attributes
        DaxLib.SVG.Transforms(
            -15,        // translate
            5,          // rotate
            BLANK(),    // scale
            -20,        // skewX
            BLANK()     // skewY
        )               // transforms
    ),                  // contents
    BLANK()             // sortValue
)
| Parameter | Type | Required | Description |
|---|---|---|---|
| translate | STRING | Translation coordinates in the format "x,y" | |
| rotate | STRING | Rotation angle in degrees, or "angle x y" for rotation around a point | |
| scale | STRING | Scale factor, or "x,y" for different scaling in each dimension | |
| skewX | STRING | Horizontal skew angle in degrees | |
| skewY | STRING | Vertical skew angle in degrees |
STRING A transform attribute value that can be used with the transform attribute of SVG elements.
function 'DaxLib.SVG.Transforms' =
    (
        translate: STRING,
        rotate: STRING,
        scale: STRING,
        skewX: STRING,
        skewY: STRING
    ) =>

        IF(NOT ISBLANK(translate),  "translate(" & translate & ") ") &
        IF(NOT ISBLANK(rotate),     "rotate(" & rotate & ") ") &
        IF(NOT ISBLANK(scale),      "scale(" & scale & ") ") &
        IF(NOT ISBLANK(skewX),      "skewX(" & skewX & ") ") &
        IF(NOT ISBLANK(skewY),      "skewY(" & skewY & ") ")
Scales
Scale functions help you map values between different scales - essential for converting data values into SVG coordinates. These are generally helper functions used in daxlib.svg.compound.*.
| Name | Type | Required | Description |
|---|---|---|---|
| inputValue | NUMERIC VAL | The value to map | |
| fromMin | NUMERIC VAL | The minimum value of the original scale | |
| fromMax | NUMERIC VAL | The maximum value of the original scale | |
| toMin | NUMERIC VAL | The minimum value of the new scale | |
| toMax | NUMERIC VAL | The maximum value of the new scale |
NUMERIC mapped value
Colors
Color functions provide theme support and color manipulation utilities, for example we can you DaxLib.SVG.Color.Theme() to return a theme colours.
DaxLib.SVG.SVG(
    500,                // width
    100,                // height
    "0 0 100 20",       // viewbox
    DaxLib.SVG.Element.Circle(
        50,             // cx
        10,             // cy
        "10%",          // r
        DaxLib.SVG.Attr.Shapes(
            DaxLib.SVG.Colour.Theme(
                "Power BI",
                25
            ),              // fill
            0.5,            // fillOpacity
            BLANK(),        // fillRule
            DaxLib.SVG.Colour.Theme(
                "Power BI",
                25
            ),              // stroke
            1,              // strokeWidth
            BLANK(),        // strokeOpacity
            BLANK()         // opacity
        ),              // attributes
        BLANK()         // transforms
    ),                  // contents
    BLANK()             // sortValue
)
| Name | Type | Required | Description |
|---|---|---|---|
| themeName | STRING | Theme name | |
| variant | INT64 | Variant index (1-N, wraps around if exceeds available variants) |
STRING Hex color code
| Variant | Power BI | Modern Corporate | Ocean Breeze | Sunset Vibes | Forest Green | Purple Rain | Monochrome | Vibrant Tech | Earth Tones | Pastel Dreams | Midnight Blue |
|---|---|---|---|---|---|---|---|---|---|---|---|
| 1 | |||||||||||
| 2 | |||||||||||
| 3 | |||||||||||
| 4 | |||||||||||
| 5 | |||||||||||
| 6 | |||||||||||
| ... | ... | ... | ... | ... | ... | ... | ... | ... | ... | ... | ... |
| 41 |
function 'DaxLib.SVG.Color.Theme' =
    (
        themeName: STRING,
        variant: INT64
    ) =>

        VAR Themes =
            DATATABLE(
            "ThemeName", STRING,
            "Variant", INTEGER,
            "Color", STRING,
            {
                // Power BI Default
                {"Power BI", 1, "#118DFF"},
                {"Power BI", 2, "#12239E"},
                {"Power BI", 3, "#E66C37"},
                {"Power BI", 4, "#6B007B"},
                {"Power BI", 5, "#E044A7"},
                {"Power BI", 6, "#744EC2"},
                {"Power BI", 7, "#D9B300"},
                {"Power BI", 8, "#D64550"},
                {"Power BI", 9, "#197278"},
                {"Power BI", 10, "#1AAB40"},
                {"Power BI", 11, "#15C6F4"},
                {"Power BI", 12, "#4092FF"},
                {"Power BI", 13, "#FFA058"},
                {"Power BI", 14, "#BE5DC9"},
                {"Power BI", 15, "#F472D0"},
                {"Power BI", 16, "#B5A1FF"},
                {"Power BI", 17, "#C4A200"},
                {"Power BI", 18, "#FF8080"},
                {"Power BI", 19, "#00DBBC"},
                {"Power BI", 20, "#5BD667"},
                {"Power BI", 21, "#0091D5"},
                {"Power BI", 22, "#4668C5"},
                {"Power BI", 23, "#FF6300"},
                {"Power BI", 24, "#99008A"},
                {"Power BI", 25, "#EC008C"},
                {"Power BI", 26, "#533285"},
                {"Power BI", 27, "#99700A"},
                {"Power BI", 28, "#FF4141"},
                {"Power BI", 29, "#1F9A85"},
                {"Power BI", 30, "#25891C"},
                {"Power BI", 31, "#0057A2"},
                {"Power BI", 32, "#002050"},
                {"Power BI", 33, "#C94F0F"},
                {"Power BI", 34, "#450F54"},
                {"Power BI", 35, "#B60064"},
                {"Power BI", 36, "#34124F"},
                {"Power BI", 37, "#6A5A29"},
                {"Power BI", 38, "#1AAB40"},
                {"Power BI", 39, "#BA141A"},
                {"Power BI", 40, "#0C3D37"},
                {"Power BI", 41, "#0B511F"},

                // Modern Corporate - Professional blues and grays
                {"Modern Corporate", 1, "#2E3440"},
                {"Modern Corporate", 2, "#3B4252"},
                {"Modern Corporate", 3, "#434C5E"},
                {"Modern Corporate", 4, "#4C566A"},
                {"Modern Corporate", 5, "#5E81AC"},
                {"Modern Corporate", 6, "#81A1C1"},

                // Ocean Breeze - Cool blues and teals
                {"Ocean Breeze", 1, "#0077BE"},
                {"Ocean Breeze", 2, "#00A8CC"},
                {"Ocean Breeze", 3, "#40E0D0"},
                {"Ocean Breeze", 4, "#87CEEB"},
                {"Ocean Breeze", 5, "#B0E0E6"},
                {"Ocean Breeze", 6, "#E0F6FF"},

                // Sunset Vibes - Warm oranges and reds
                {"Sunset Vibes", 1, "#FF6B35"},
                {"Sunset Vibes", 2, "#F7931E"},
                {"Sunset Vibes", 3, "#FFD23F"},
                {"Sunset Vibes", 4, "#EE4B2B"},
                {"Sunset Vibes", 5, "#C04000"},
                {"Sunset Vibes", 6, "#FFCBA4"},

                // Forest Green - Natural greens
                {"Forest Green", 1, "#355E3B"},
                {"Forest Green", 2, "#228B22"},
                {"Forest Green", 3, "#32CD32"},
                {"Forest Green", 4, "#90EE90"},
                {"Forest Green", 5, "#98FB98"},
                {"Forest Green", 6, "#F0FFF0"},

                // Purple Rain - Rich purples
                {"Purple Rain", 1, "#301934"},
                {"Purple Rain", 2, "#663399"},
                {"Purple Rain", 3, "#9966CC"},
                {"Purple Rain", 4, "#BA55D3"},
                {"Purple Rain", 5, "#DDA0DD"},
                {"Purple Rain", 6, "#E6E6FA"},

                // Monochrome - Sophisticated grays
                {"Monochrome", 1, "#1C1C1C"},
                {"Monochrome", 2, "#333333"},
                {"Monochrome", 3, "#666666"},
                {"Monochrome", 4, "#999999"},
                {"Monochrome", 5, "#CCCCCC"},
                {"Monochrome", 6, "#F5F5F5"},

                // Vibrant Tech - Bold and energetic
                {"Vibrant Tech", 1, "#FF0080"},
                {"Vibrant Tech", 2, "#00FFFF"},
                {"Vibrant Tech", 3, "#FFFF00"},
                {"Vibrant Tech", 4, "#FF8000"},
                {"Vibrant Tech", 5, "#8000FF"},
                {"Vibrant Tech", 6, "#00FF80"},

                // Earth Tones - Natural browns and beiges
                {"Earth Tones", 1, "#8B4513"},
                {"Earth Tones", 2, "#A0522D"},
                {"Earth Tones", 3, "#CD853F"},
                {"Earth Tones", 4, "#DEB887"},
                {"Earth Tones", 5, "#F4A460"},
                {"Earth Tones", 6, "#FFF8DC"},

                // Pastel Dreams - Soft and gentle
                {"Pastel Dreams", 1, "#FFB3BA"},
                {"Pastel Dreams", 2, "#FFDFBA"},
                {"Pastel Dreams", 3, "#FFFFBA"},
                {"Pastel Dreams", 4, "#BAFFC9"},
                {"Pastel Dreams", 5, "#BAE1FF"},
                // {"Pastel Dreams", 6, "#E1BAFF"},

                // Midnight Blue - Deep blues and navy
                {"Midnight Blue", 1, "#191970"},
                {"Midnight Blue", 2, "#000080"},
                {"Midnight Blue", 3, "#0000CD"},
                {"Midnight Blue", 4, "#4169E1"},
                {"Midnight Blue", 5, "#6495ED"},
                {"Midnight Blue", 6, "#B0C4DE"}
            }
        )

        VAR ThemeColors = FILTER(Themes, [ThemeName] = themeName)
        VAR MaxVariant = MAXX(ThemeColors, [Variant])
        VAR AdjustedVariant = IF(
            MaxVariant > 0,
            MOD( variant - 1, MaxVariant ) + 1,
            variant
        )
        VAR SelectedColor =
            MAXX(
                FILTER( ThemeColors, [Variant] = AdjustedVariant),
                [Color]
            )

        RETURN SelectedColor
Contribute
This is a good start at defining the basic structure of the library, but I think a missing category of functions is daxlib.visual.* which uses the existing function, but with a simpler interface, to create even more elaborate SVGs. Additionally I think there is scope for axis label. Any suggestions or help would be great! Look out for upcoming documentation on how to contribute to DAX Lib official libraries.