DaxLib.SVG 0.2.3
DaxLib.SVG v0.2.3-beta release
I am happy to announce the release of DaxLib.SVG v0.2.3-beta. DaxLib.SVG is a DAX UDF library designed to help make creating SVGs in Power BI easier for everyone. v0.2.3-beta brings some performance improvements to the DaxLib.SVG.Compound.* functions.
Changes
Some performance improvements have been made to DaxLib.SVG.Compound.*
- Reduced data cache materialization
- Moved duplicate calculations out of iterators
To validate improvements using the DAX Performance Testing notebook from the Fabric Toolbox, using the methodology detailed in a previous post.
- Tested using Contoso 1 Million Row Dataset
- Functions tested in Table and Card context
- Functions tested with large and small
xAxis('Date'[Date]and'Date'[YearMonth]) - 5 runs per measures, for warm and hot cache
To prove significant difference in the improvements I used a T-test with 95% Confidence.
T-test
VAR CriticalValue = 1.96 -- 95% Confidence Level

// old
VAR oldMean =
    CALCULATE(
        [Avg Duration],
        REMOVEFILTERS(Query[Variant], Query[Variant Sort]),
        Query[Variant] = "Old"
    )
VAR oldSD =
    CALCULATE(
        [SD Duration],
        REMOVEFILTERS(Query[Variant], Query[Variant Sort]),
        Query[Variant] = "Old"
    )
VAR oldCount =
    CALCULATE(
        COUNTROWS(Query), -- Or COUNT(Query[ID])
        REMOVEFILTERS(Query[Variant], Query[Variant Sort]),
        Query[Variant] = "Old"
    )

// new
VAR newMean =
    CALCULATE(
        [Avg Duration],
        REMOVEFILTERS(Query[Variant], Query[Variant Sort]),
        Query[Variant] = "New"
    )

VAR newSD =
    CALCULATE(
        [SD Duration],
        REMOVEFILTERS(Query[Variant], Query[Variant Sort]),
        Query[Variant] = "New"
    )

VAR newCount =
    CALCULATE(
        COUNTROWS(Query),
        REMOVEFILTERS(Query[Variant], Query[Variant Sort]),
        Query[Variant] = "New"
    )

-- 3. CALCULATE STANDARD ERROR
-- Formula: Sqrt( (s1^2/n1) + (s2^2/n2) )
VAR varianceOld = DIVIDE( POWER(oldSD, 2), oldCount )
VAR varianceNew = DIVIDE( POWER(newSD, 2), newCount )
VAR standardError = SQRT( varianceOld + varianceNew )

-- 4. CALCULATE Z-SCORE
-- (NewMean - OldMean) / Standard Error
VAR meanDiff = newMean - oldMean
VAR zScore = DIVIDE( meanDiff, standardError, 0 )

-- 5. DEFINE COLORS
VAR bad = "#8F2D56"      -- Significantly Higher
VAR good = "#006400"     -- Significantly Lower
VAR neutral = "#808080"  -- Not Significant

RETURN
    IF(
        SELECTEDVALUE(Query[Variant]) = "New",
        SWITCH(
            TRUE,
            zScore < -CriticalValue, good,   -- New is Statistically LOWER (Greed = Good)
            zScore > CriticalValue, bad,     -- New is Statistically HIGHER (Red = Bad)
            neutral                          -- No statistical difference
        ),
        "#CCCCCC" -- Default color for "Old" or other bars
    )
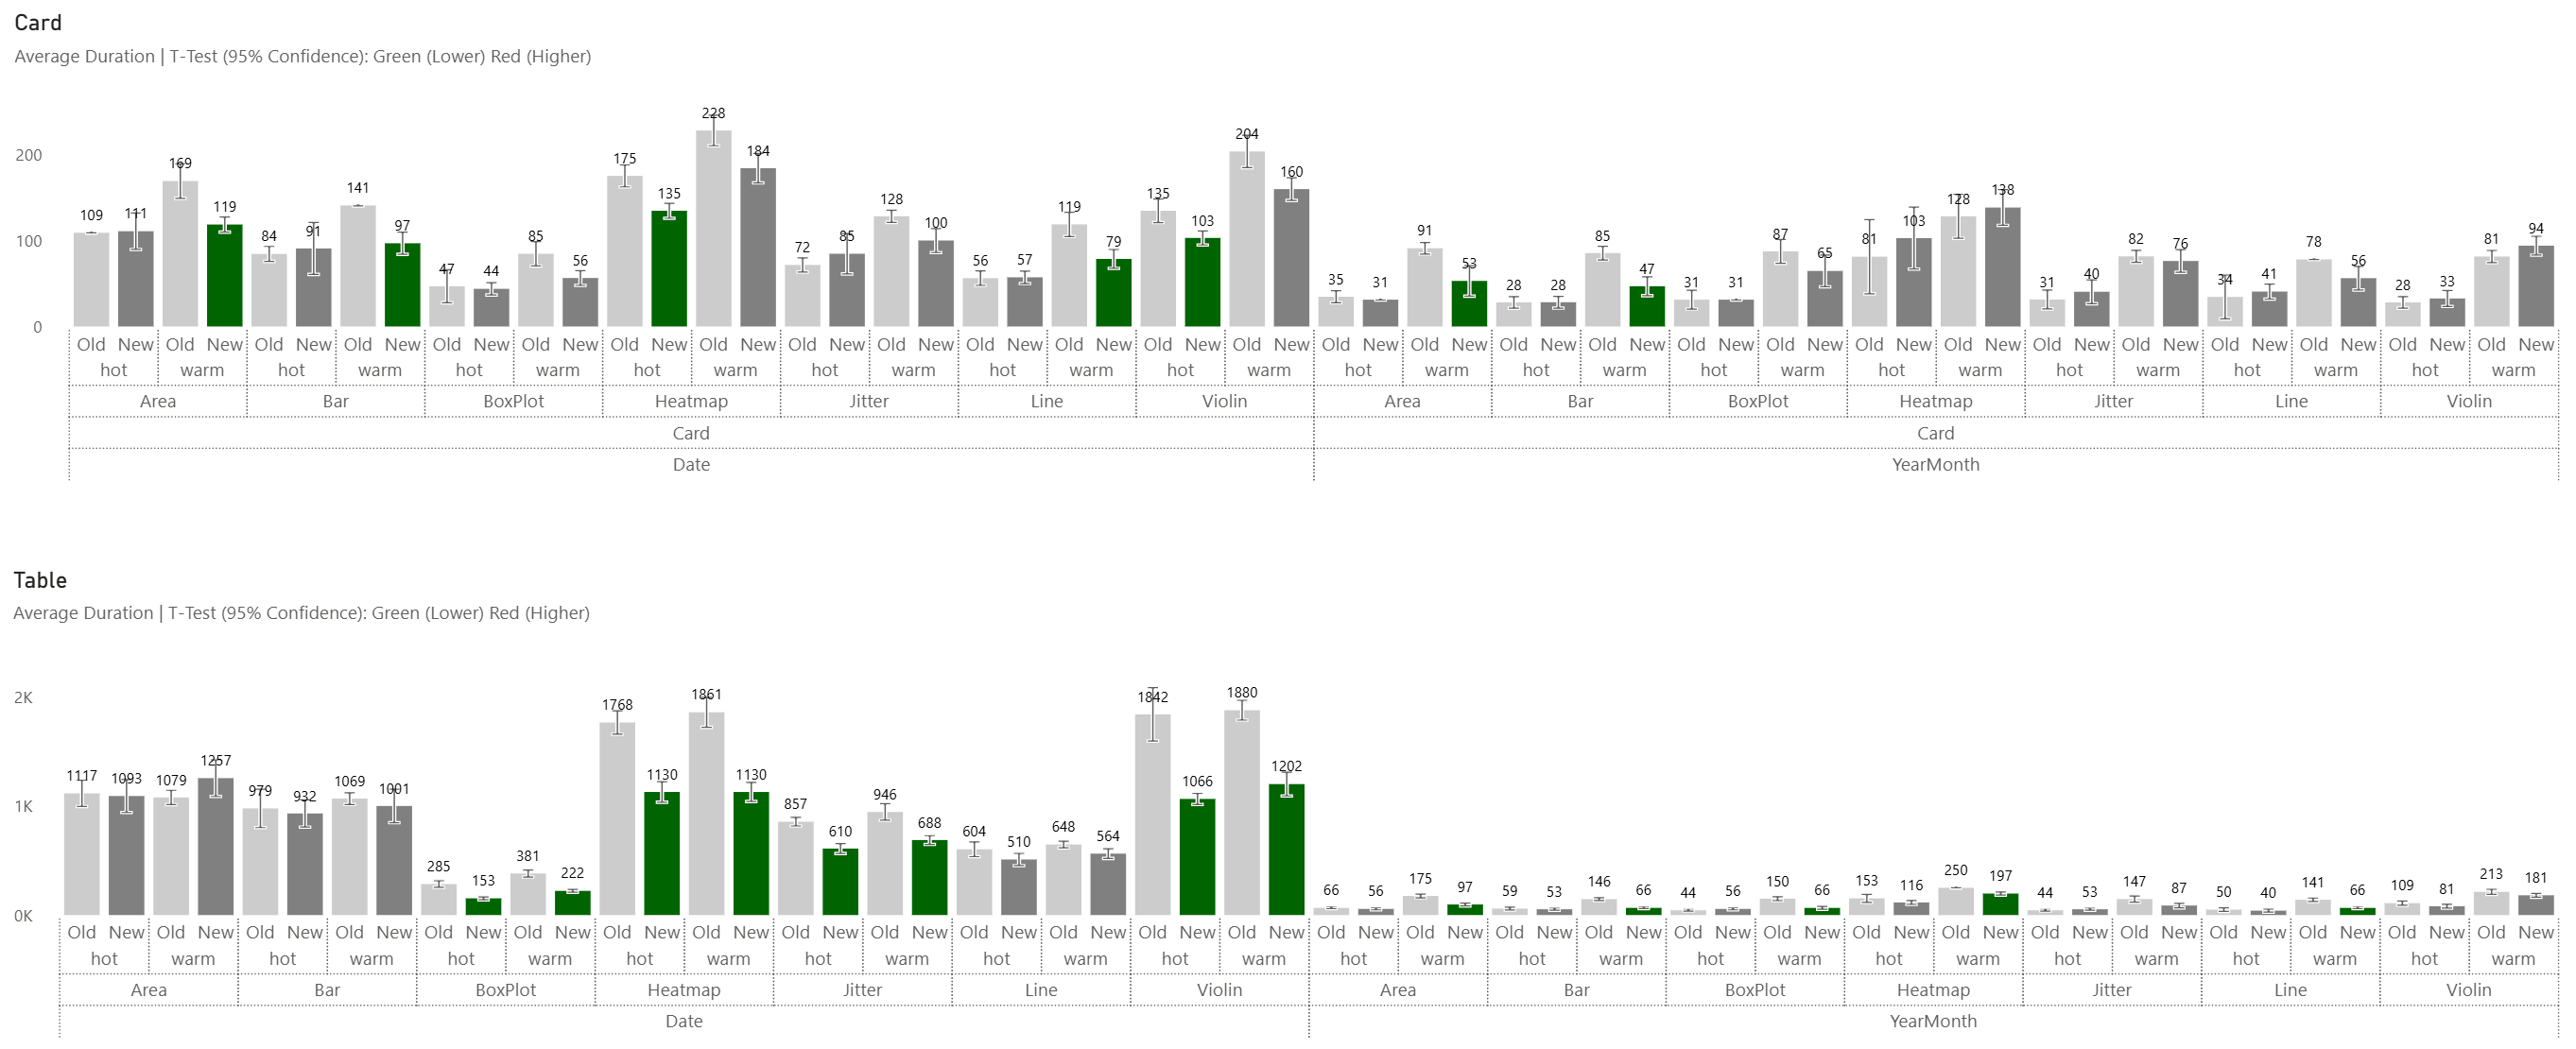
If we look at the v0.2.2-beta (old) vs v0.2.3-beta (new) we can see that all the new function variants are the same or better. The bigger improvements are seen in the DaxLib.SVG.Compound.Heatmap and DaxLib.SVG.Compound.Violin, the most previously most expensive function, which are now similar to the other DaxLib.SVG.Compound.* functions.
If anyone else wants to take a crack at improving the Library or build their own look at the DAXLib docs on how to contribute.