Deneb Gantt Chart
Using Deneb and Vega-Lite to create a Gantt Chart if Power BI
The Fabric Log Analytics for Analysis Services Engine report template has Gantt chart presumably inspired by Phil Seamark blog. The problem is the template uses Craydec timeline visual which is not certified and therefore I can't use it at work. Annoyingly, all the other Gantt charts on the App store seem only work down to a day level, not the hours, minutes and seconds that would represent a refresh operation. Fortunately Deneb is a certified visual with a alot of flexibility and possibility, so I had a stab at creating a replica. My first though was to modify David Bacci incredible Gantt Chart, but as I only just starting out with Deneb, it was a little too overwhelming and complicated for my simple use case, so I started from scratch with Vega-lite.
Firstly why? Power BI has two part, the report and the semantic model. The semantic model is a instance of SSAS Tabular, an in-memory columnar database. Unlike a transitional database that are row-oriented, aiming for rapid transaction on individuals rows, SSAS Tabular is instead column-oriented, aiming to performance aggregations over large number of rows to answer analytical queries. A Semantic Model has 1 or more tables and those each have 1 or more partition. During a refresh:
- Data is read from the data source
- Data is compressed (row-length encoding) and encoded (hash/value encoding) into columns
- Metadata is calculated, such as relationships between tables and calculated tables/columns
Partitions can be refresh in parallel, and the amount of parallelism can be set see Chris Webb.
By looking at all the operations on the partitions of the semantic model as a gantt chart we are able to determine if there are any bottlenecks in a slow refresh, which informs any optimization work.
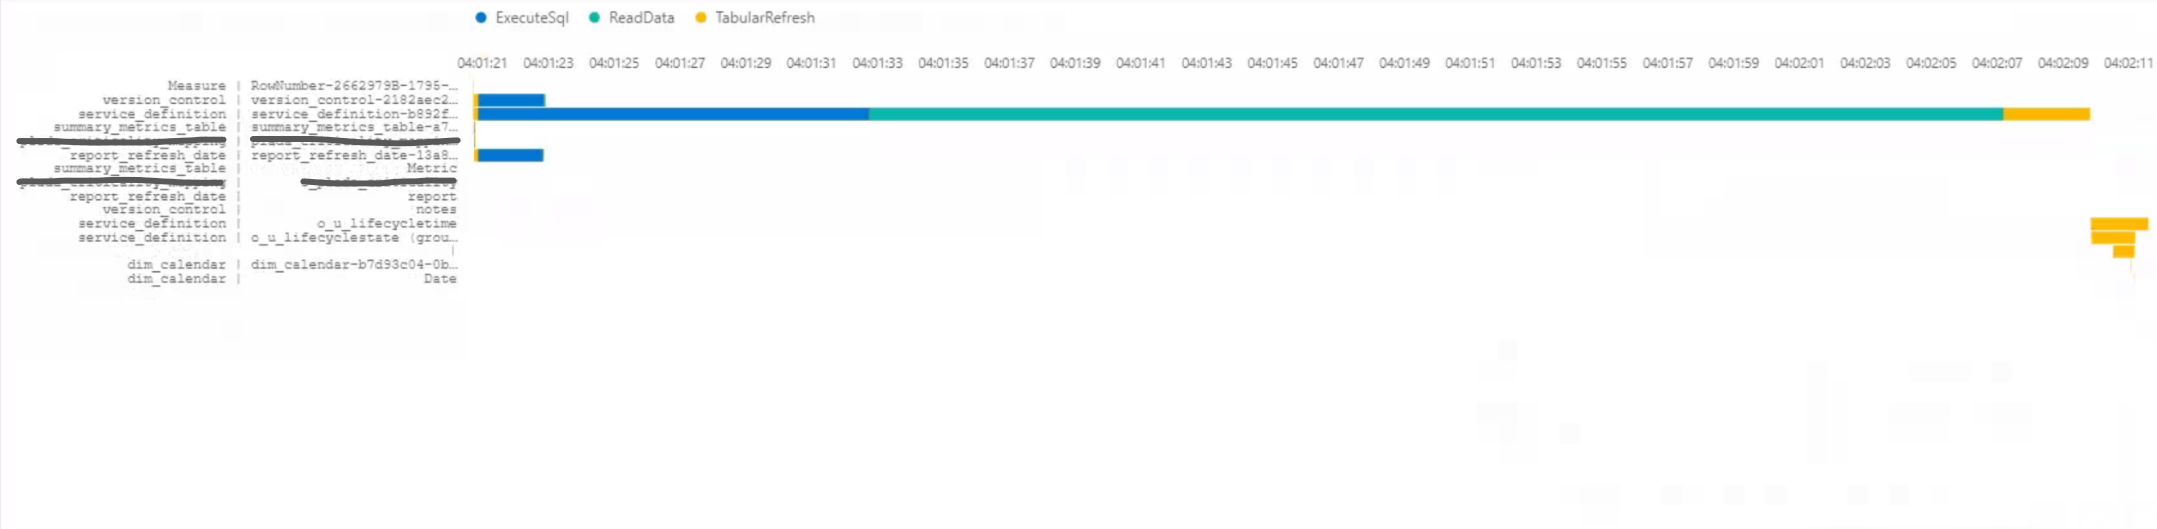
The Craytec timelines Gantt looks like this for a refresh:
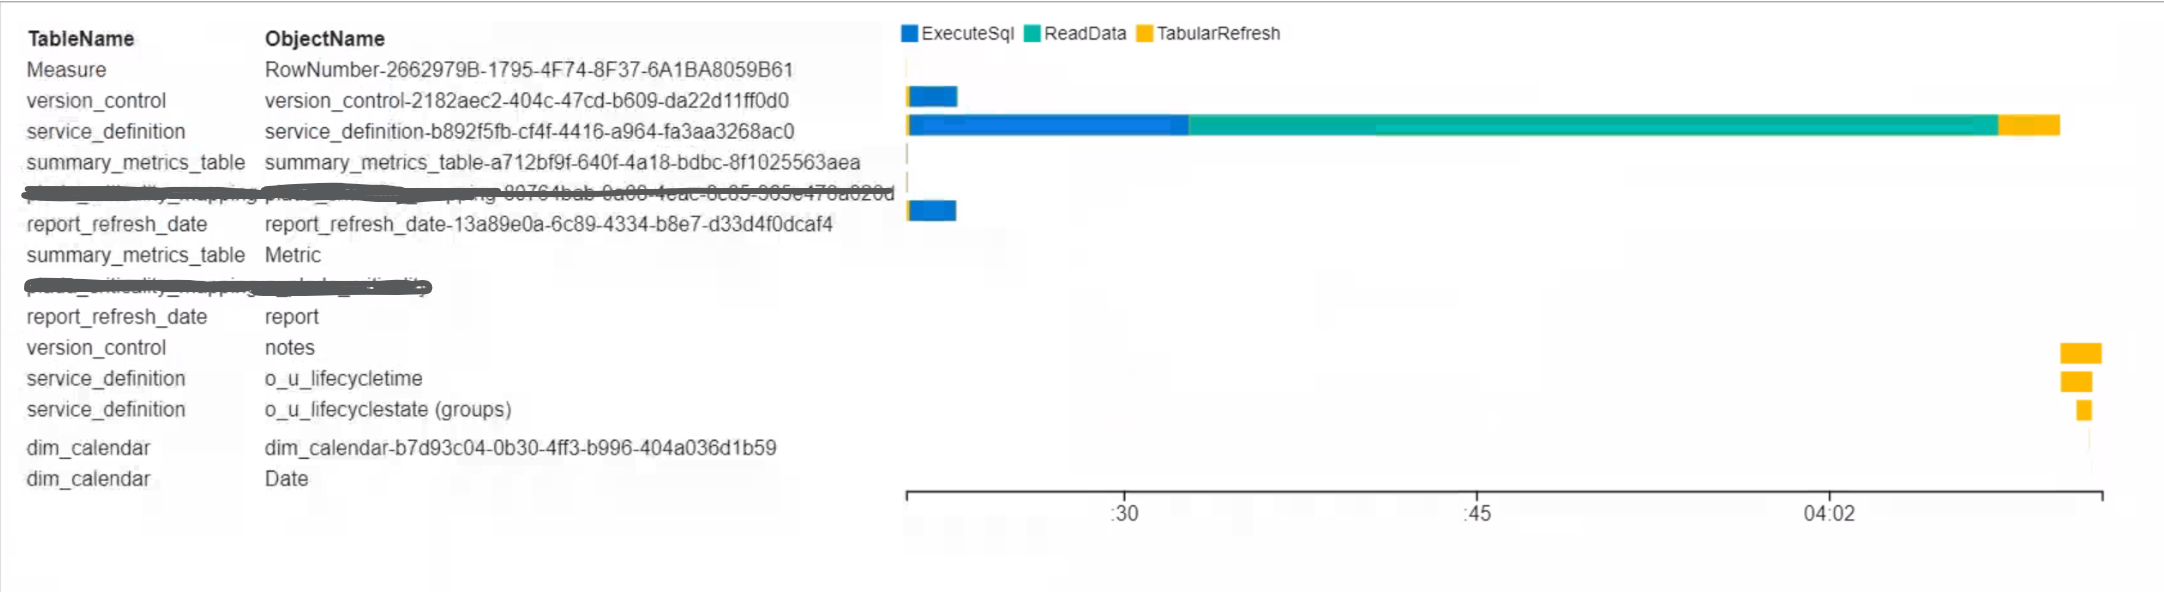
And this is what I managed in a afternoon with Deneb.
I did run into some quirks of the framework
- White space in a label is trimmed therefore I used a NO-BREAK SPACE instead of regular space to pad text
- In the refresh several operations occur at the same time for the partition, to have the bars overlap you first need to set
stack = nulland in order to get the appropriate z-order, avoiding a large bar obscuring others I had to set"order": {"aggregate": "max", "field": "startTime"}, to bubble the hidden bars to the top
{
  "data": {
    "name": "dataset"
  },
  "transform": [
    {
      "calculate": "truncate(datum.TableName, 25) + ' | ' + pad(truncate(datum.ObjectName, 25), 25, ' ', 'left') ",
      "as": "Table|Partition"
    }
  ],
  "height": {
    "step": 8
  },
  "mark": "bar",
  "encoding": {
    "y": {
      "field": "Table|Partition",
      "axis": {
        "labelLimit": 400,
        "labelFont": "Courier New"
      },
      "type": "nominal",
      "sort": "x"
    },
    "x": {
      "field": "startTime",
      "type": "temporal",
      "stack": null,
      "axis": {
        "orient": "top",
        "format": "%H:%M:%S",
        "formatType": "time"
      }
    },
    "x2": {
      "field": "endTime"
    },
    "color": {
      "field": "OperationDetailName",
      "type": "ordinal",
      "scale": {
        "scheme": "pbiColorNominal"
      }
    },
    "order": {
      "aggregate": "max",
      "field": "startTime"
    },
    "tooltip": [
      {
        "field": "OperationDetailName",
        "title": "Operation"
      },
      {
        "field": "TableName",
        "title": "Table"
      },
      {
        "field": "ObjectName",
        "title": "Partition"
      },
      {
        "field": "startTime",
        "type": "temporal",
        "timeUnit": "yearmonthdate",
        "title": "Start"
      },
      {
        "field": "endTime",
        "type": "temporal",
        "timeUnit": "hoursminutesseconds",
        "title": "End"
      }
    ]
  }
}
{
  "autosize": {
    "contains": "padding",
    "type": "fit"
  },
  "view": {
    "stroke": "transparent"
  },
  "font": "Segoe UI",
  "arc": {},
  "area": {
    "line": true,
    "opacity": 0.6
  },
  "bar": {},
  "line": {
    "strokeWidth": 3,
    "strokeCap": "round",
    "strokeJoin": "round"
  },
  "point": {
    "filled": true,
    "size": 75
  },
  "rect": {},
  "text": {
    "font": "Segoe UI",
    "fontSize": 12,
    "fill": "#605E5C"
  },
  "axis": {
    "ticks": false,
    "grid": false,
    "domain": false,
    "labelColor": "#605E5C",
    "labelFontSize": 8,
    "title": null,
    "titleFont": "din",
    "titleColor": "#252423",
    "titleFontSize": 10,
    "titleFontWeight": "normal"
  },
  "axisQuantitative": {
    "tickCount": 3,
    "grid": true,
    "gridColor": "#C8C6C4",
    "gridDash": [
      1,
      5
    ],
    "labelFlush": false
  },
  "axisX": {
    "labelPadding": 5
  },
  "axisY": {
    "labelPadding": 10
  },
  "header": {
    "titleFont": "din",
    "titleFontSize": 16,
    "titleColor": "#252423",
    "labelFont": "Segoe UI",
    "labelFontSize": 13.333333333333332,
    "labelColor": "#605E5C"
  },
  "legend": {
    "titleFont": "Segoe UI",
    "titleFontWeight": 200,
    "title": null,
    "titleColor": "#605E5C",
    "labelFont": "Segoe UI",
    "labelFontSize": 9,
    "labelColor": "#605E5C",
    "symbolType": "circle",
    "symbolSize": 40,
    "orient": "top"
  },
  "path": {},
  "shape": {},
  "symbol": {
    "strokeWidth": 1.5,
    "size": 50
  }
}
Conclusion
Deneb is a great tool, bring the frameworks of vega and vega-lite to Power BI. There is a steep learning curve, but that is mostly related to volume of knowledge required, knowing the schema of framework and what is possible. Will have to try and find more time to look at Deneb more in the future.