Optimizing the SVG Heatmap
Optimizing the SVG Heatmap using the Sparkline measure pattern
A quick post that is the cumulation of a couple of previous posts, optimizing the heatmap SVG using the Power BI Sparklines pattern.
Performance
Running on the Fabric Log Analytics for Analysis Services Engine report template hydrated with a months worth of logs. I captured the query that generated the following matrix.
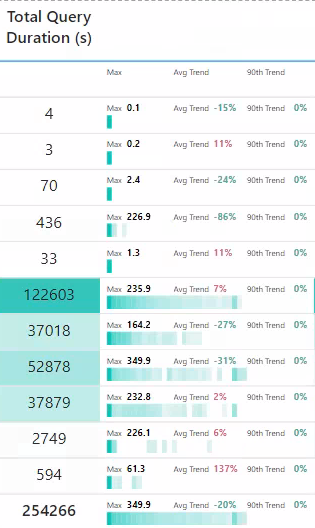
Command CPU (s) Heatmap SVG =
VAR __svgHeight = 20
VAR __svgWidth = 150

VAR _numBoxes = 40
VAR _boxWidth = __svgWidth / _numBoxes

VAR __Categories = VALUES( ExecutionMetrics[XmlaRequestId] )
VAR __Range =
    MAXX(
        ALLSELECTED( ExecutionMetrics[XmlaRequestId] ),
        CALCULATE(
            SUM( ExecutionMetrics[totalCpuTimeMs] ) / 1000
            ,ExecutionMetrics[LogAnalyticsCategory]= "Command"
            ,REMOVEFILTERS( Artifact )
        )
    )

VAR __Data =
    ADDCOLUMNS(
        KEEPFILTERS(
            FILTER(
                KEEPFILTERS( __Categories ),
                not ISBLANK(
                    CALCULATE(
                        SUM( ExecutionMetrics[totalCpuTimeMs] ) / 1000
                        ,ExecutionMetrics[LogAnalyticsCategory]= "Command"
                    )
                )
            )
        ),
        "@box",
            INT(
                (
                    CALCULATE(
                        SUM( ExecutionMetrics[totalCpuTimeMs] ) / 1000
                        ,ExecutionMetrics[LogAnalyticsCategory]= "Command"
                    ) /   __Range
                ) * (_numBoxes - 1 )
            ) + 1
    )
VAR _countPerBox =
    ADDCOLUMNS(
        SUMMARIZE( __Data, [@box] )
        ,"@x", ( [@box] * _boxWidth ) - _boxWidth // could do this elsewhere
        ,"@cnt",
            VAR _box =  [@box]
            RETURN
            CALCULATE( COUNTX ( __Data, IF( [@box] = _box && _box <> 0, 1 ) ) )
    )
VAR _cntRange = MAXX( _countPerBox, [@cnt] )
VAR __Boxes =
    CONCATENATEX(
        ADDCOLUMNS(
            _countPerBox
            ,"@Boxes"
            ,// Mapping values range 0 -> 255
            VAR _inputStart =           0                   // The lowest number of the range input
            VAR _inputEnd =             LOG( _cntRange, 10 )    // The largest number of the range input
            VAR _outputStart =          255                            // The lowest number of the range output
            VAR _outputEnd =            0                     // The largest number of the range output
            VAR _outputVal =            _outputStart + ((_outputEnd - _outputStart) / (_inputEnd - _inputStart)) * ( LOG( [@cnt], 10 ) - _inputStart)
            // https://dax.tips/2019/10/02/dax-base-conversions/
            VAR ConvertMe = IFERROR( _outputVal, 255 )
            VAR Base = 16
            VAR BitTable = GENERATESERIES ( 1, 8 )
            VAR DEC2HEX =
                CONCATENATEX(
                    BitTable,
                    VAR c = MOD( TRUNC ( ConvertMe / POWER ( base, [value] - 1 ) ), base )
                    RETURN SWITCH(c,10,"A",11,"B",12,"C",13,"D",14,"E",15,"F",c),
                    ,[Value],Desc
                )
            VAR HEX = "#" & REPT( RIGHT( DEC2HEX, 2 ), 3 ) & IF( ConvertMe = 255, "00", "" )
            RETURN
            "<rect id='box' x='" & [@x] & "' y='" & __svgHeight / 2 & "' width='" & _boxWidth & "' height='" & __svgHeight / 2 & "' fill='" & HEX & "' filter='url(#gradient)'/>"
        )
        ,[@Boxes]
        ," "
        ,[@x]
    )

// Trends
var dt = MAX( Dates[Date] )
var _greenHex = "#37A794"
var _redHex = "#DD6B7F"

VAR __MaxVal =
    MAXX(
        VALUES( ExecutionMetrics[XmlaRequestId] ),
        CALCULATE(
            SUM( ExecutionMetrics[totalCpuTimeMs] ) / 1000
            ,ExecutionMetrics[LogAnalyticsCategory]= "Command"
        )
    )

// Avg Trend
var _MonthAverageAvg =
    CALCULATE(
        AVERAGEX( VALUES( ExecutionMetrics[XmlaRequestId] ), CALCULATE( SUM( ExecutionMetrics[totalCpuTimeMs] ) ) / 1000 )
        ,REMOVEFILTERS( Dates )
        ,DATESINPERIOD( Dates[Date], dt, -1, MONTH )
        ,ExecutionMetrics[LogAnalyticsCategory] = "Command"
    )
var _WeekAverageAvg =
    CALCULATE(
        AVERAGEX( VALUES( ExecutionMetrics[XmlaRequestId] ), CALCULATE( SUM( ExecutionMetrics[totalCpuTimeMs] ) ) / 1000 )
        ,REMOVEFILTERS( Dates )
        ,DATESINPERIOD( Dates[Date], dt, -7, DAY )
        ,ExecutionMetrics[LogAnalyticsCategory] = "Command"
    )
Var _trendAvg = IF( not ISBLANK( _MonthAverageAvg ), (1 - ( _WeekAverageAvg / _MonthAverageAvg )) * - 1 )
Var _trendAvgHex = IF( _trendAvg > 0, _redHex, _greenHex )

// 90 Percentile Trend
var _MonthAverage90th =
    CALCULATE(
        PERCENTILEX.INC( VALUES( ExecutionMetrics[XmlaRequestId] ), CALCULATE( SUM( ExecutionMetrics[totalCpuTimeMs] ) ) / 1000, 0.9)
        ,REMOVEFILTERS( Dates )
        ,DATESINPERIOD( Dates[Date], dt, -1, MONTH )
        ,ExecutionMetrics[LogAnalyticsCategory] = "Command"
    )
var _WeekAverage90th =
    CALCULATE(
        PERCENTILEX.INC( VALUES( ExecutionMetrics[XmlaRequestId] ), CALCULATE( SUM( ExecutionMetrics[totalCpuTimeMs] ) ) / 1000, 0.9)
        ,REMOVEFILTERS( Dates )
        ,DATESINPERIOD( Dates[Date], dt, -7, DAY )
        ,ExecutionMetrics[LogAnalyticsCategory] = "Command"
    )
Var _trend90th = IF( not ISBLANK( _MonthAverage90th ), (1 - ( _WeekAverage90th / _MonthAverage90th )) * - 1 )
Var _trend90thHex = IF( _trend90th > 0, _redHex, _greenHex )

VAR __Svg =
    "data:image/svg+xml;utf8, <svg width=""" & __svgWidth & """ height=""" & __svgHeight &""" xmlns=""http://www.w3.org/2000/svg"">" &
    "<defs>
        <filter id=""gradient"" color-interpolation-filters=""sRGB"">
            <feComponentTransfer>
                <feFuncR type=""table"" tableValues=""1 0.975"" />
                <feFuncG type=""table"" tableValues="" 0.78 0.975"" />
                <feFuncB type=""table"" tableValues=""0.2 0.975"" />
            </feComponentTransfer>
        </filter>
    </defs>" &
    "<text x='0' y='7' fill='black' font-size='6' font-family='Segoe UI, sans-serif'>Max</text>" &
    "<text x='15' y='7' fill='black' font-size='7' font-family='Segoe UI, sans-serif' font-weight='bold'>" & FORMAT(__maxVal, "0.0") & "</text>" &
    "<text x='45' y='7' fill='black' font-size='6' font-family='Segoe UI, sans-serif'>Avg Trend</text>" &
    "<text x='75' y='7' fill='" & _trendAvgHex & "' font-size='7' font-family='Segoe UI, sans-serif' font-weight='bold'>" & FORMAT(_trendAvg, "0%") & "</text>" &
    "<text x='100' y='7' fill='black' font-size='6' font-family='Segoe UI, sans-serif'>90th Trend</text>" &
    "<text x='130' y='7' fill='" & _trend90thHex & "' font-size='7' font-family='Segoe UI, sans-serif' font-weight='bold'>" & FORMAT(_trend90th, "0%") & "</text>" &
    __Boxes &
    "</svg>"

RETURN
IF( not ISEMPTY(__Data), __Svg )
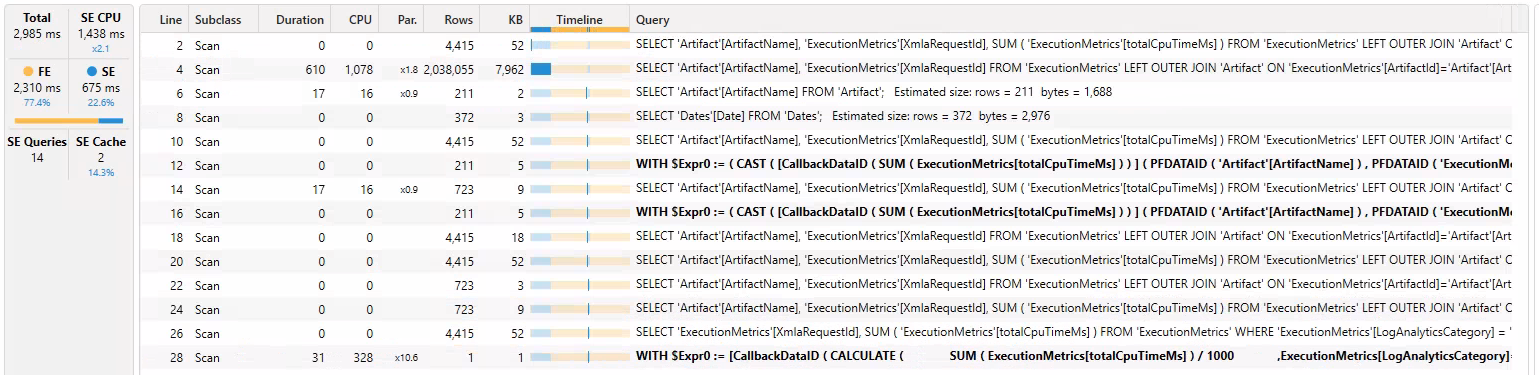
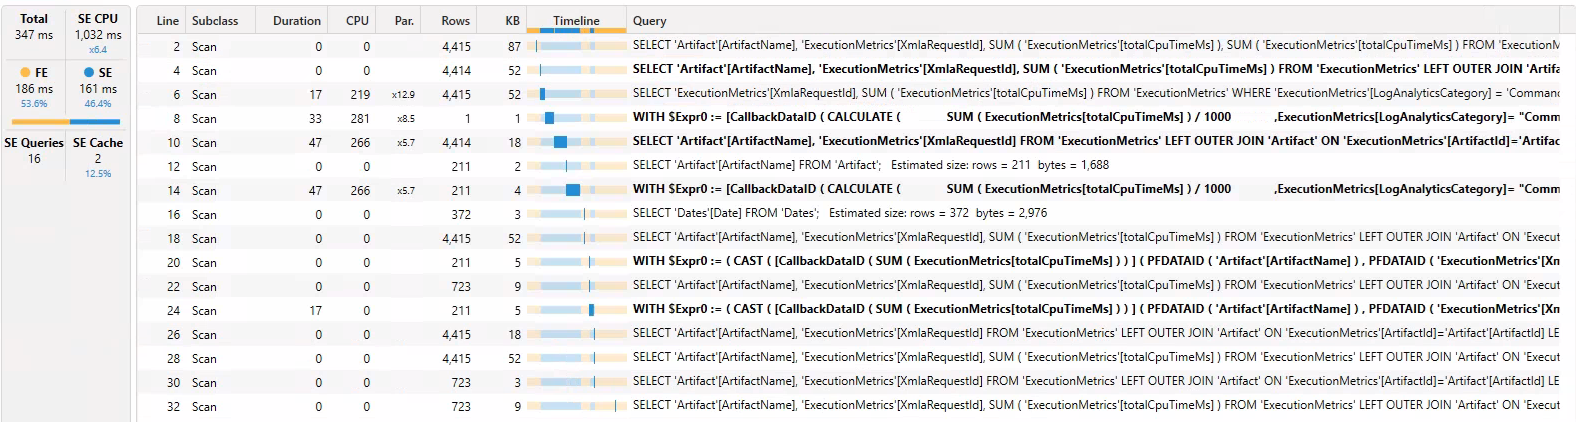
Running server timing on DAX Studio you can see that the old code causes the materialization of a large data cache and uses a large amount of formula engine, taking nearly 3 seconds. Adjusting the code to a similar pattern to sparklines we reduce this by 90% to 347ms, with no large materialization.
Conclusions
This is a fantastic pattern, that is reasonably easy to implement and obtain good results. Of note I test the performance of the Violin plot, and it already very good, and doesn't require any improvement.