SVG Rendering Cost in Power BI
Investigation the factors that affect SVG rendering performance in Power BI
I recently attended Chris Webb's SQLBits session, Secrets of Power BI Performance Analyzer. The talk focused on report page processing, from query generation to the final rendering of visuals. Depending on the visual, the process can also include extras like geocoding and image loading.
After my DAXLib session, we briefly chatted about the render performance for SVGs and I realized for my DaxLib.SVG library, my primary focus has been on optimizing the DAX performance but I've not thought about cost of actually rendering the images. So to beat Chris to the punch with his unstoppable weekly blogging cadence I raced to see what I could discover.
Test Subjects
I consulted AI on which elements might be expensive to render, and it suggested animations <animate>, complex filters <filter>, and gradients <radialGradient>. This is related to any math the render engine will have to perform to output the visual. I also assumed that rending a large number of cheap elements might also be expensive. In addition I also added a simple humble <rect> as a baseline.
To understand the rendering cost, I added each measures to a table, each on a separate page and used Performance Analyzer to record the events. To avoid any caching I navigated to a blank page, saved, re-opened the report, started Performance Analyzer then navigated between each page.
A humble <Rect>.
SVG filters allow for applying effects like blurs, turbulence, and color transformations. These operations can be computationally intensive.
Filter =
"data:image/svg+xml;utf8,
<svg xmlns='http://www.w3.org/2000/svg' viewBox='0 0 200 200'>
  <filter id='heavyNoise'>
    <feTurbulence type='fractalNoise' baseFrequency='0.02' numOctaves='8' result='noise' />
    <feColorMatrix type='hueRotate' values='90' />
  </filter>
  <rect width='200' height='200' filter='url(#heavyNoise)' />
</svg>"
Gradients, especially complex radial gradients applied to multiple objects, could also impact rendering time.
Gradient =
"data:image/svg+xml;utf8,
<svg xmlns='http://www.w3.org/2000/svg' viewBox='0 0 200 200'>
  <defs>
    <radialGradient id='grad1' cx='50%' cy='50%' r='50%'>
      <stop offset='0%' stop-color='rgba(255,0,0,0.5)' />
      <stop offset='100%' stop-color='rgba(0,0,255,0.5)' />
    </radialGradient>
  </defs>
  <circle cx='100' cy='100' r='90' fill='url(#grad1)' stroke='rgba(0,255,0,0.5)' stroke-width='20' />
  <circle cx='100' cy='100' r='70' fill='url(#grad1)' stroke='rgba(255,255,0,0.5)' stroke-width='20' />
  <circle cx='100' cy='100' r='50' fill='url(#grad1)' stroke='rgba(255,0,255,0.5)' stroke-width='20' />
</svg>"
What is the cost of rendering many simple shapes versus one complex shape? Lets look at a bunch of circles.
Many Circles =
VAR NumItems = 1000
VAR Circles =
  ADDCOLUMNS(
    GENERATESERIES(1, NumItems),
    "cx", RAND() * 200,
    "cy", RAND() * 200,
    "r", RAND() * 5 + 1,
    "fill", "hsl(" & RAND() * 360 & ", 80%, 50%)"
  )
VAR SvgItems =
  CONCATENATEX(
    Circles,
    "<circle cx='" & [cx] & "' cy='" & [cy] & "' r='" & [r] & "' fill='" & [fill] & "' />",
    UNICHAR(10)
  )
RETURN
"data:image/svg+xml;utf8,
<svg xmlns='http://www.w3.org/2000/svg' viewBox='0 0 200 200'>" & UNICHAR(10) &
SvgItems & UNICHAR(10) &
"</svg>"
And a few more.
Even More Circles =
VAR NumItems = 10000
VAR Circles =
  ADDCOLUMNS(
    GENERATESERIES(1, NumItems),
    "cx", RAND() * 200,
    "cy", RAND() * 200,
    "r", RAND() * 5 + 1,
    "fill", "hsl(" & RAND() * 360 & ", 80%, 50%)"
  )
VAR SvgItems =
  CONCATENATEX(
    Circles,
    "<circle cx='" & [cx] & "' cy='" & [cy] & "' r='" & [r] & "' fill='" & [fill] & "' />",
    UNICHAR(10)
  )
RETURN
"data:image/svg+xml;utf8,
<svg xmlns='http://www.w3.org/2000/svg' viewBox='0 0 200 200'>" & UNICHAR(10) &
SvgItems & UNICHAR(10) &
"</svg>"
Finally, let's combine a bit of everything into one SVG to see how they compound.
Combined =
"data:image/svg+xml;utf8,
<svg xmlns='http://www.w3.org/2000/svg' viewBox='0 0 500 500'>
  <defs>
    <filter id='lag' x='-20%' y='-20%' width='140%' height='140%'>
      <feTurbulence type='fractalNoise' baseFrequency='0.05' numOctaves='4' result='noise' />
      <feDisplacementMap in='SourceGraphic' in2='noise' scale='40' xChannelSelector='R' yChannelSelector='G' />
    </filter>
    <radialGradient id='grad' cx='50%' cy='50%' r='50%'>
      <stop offset='0%' stop-color='red'>
        <animate attributeName='stop-color' values='red;blue;magenta;red' dur='0.5s' repeatCount='indefinite' />
      </stop>
      <stop offset='100%' stop-color='yellow' />
    </radialGradient>
  </defs>
  <g filter='url(#lag)'>
    <rect x='0' y='0' width='500' height='500' fill='url(#grad)'>
        <animateTransform attributeName='transform' type='rotate' from='0 250 250' to='360 250 250' dur='1.5s' repeatCount='indefinite' />
    </rect>
    <circle cx='250' cy='250' r='100' fill='rgba(255,255,255,0.6)'>
        <animate attributeName='r' values='10;250;10' dur='0.3s' repeatCount='indefinite' />
    </circle>
  </g>
</svg>"
Results
After recording all the pages we can look at the results. I did look at the json export but it didn't provide any extra insights. We can see all tests performed similarly except for [Even More Circles] which did have a some dax duration, but we also get a longer Visual Display and Other.
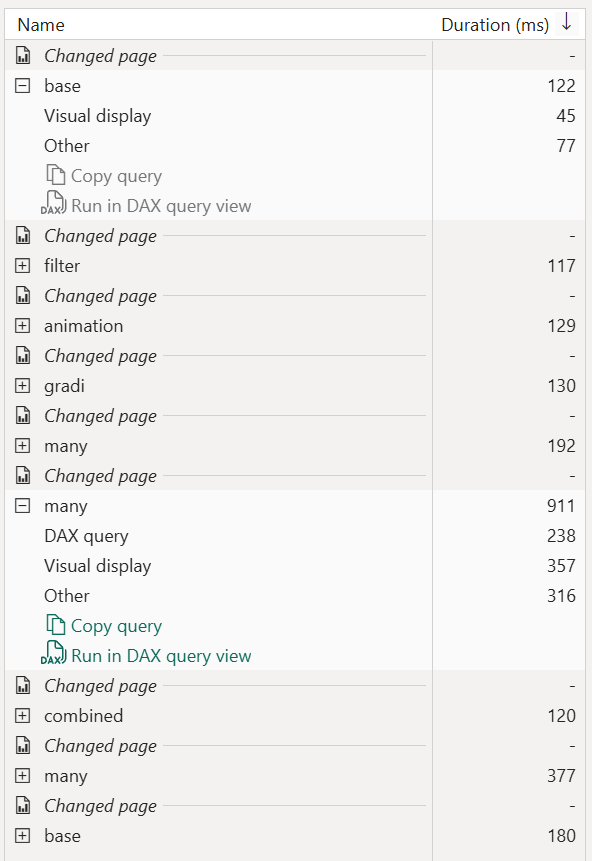
I did try to increase the number of circles in [Even More Circles] from 10,000 to 100,000 but I hit the max string length.

Just to see if I could really torture Power BI, I copied the [Even More Circles] measure into 10 separate measure (to avoid any caching) and added them to 10 separate tables on the same page.
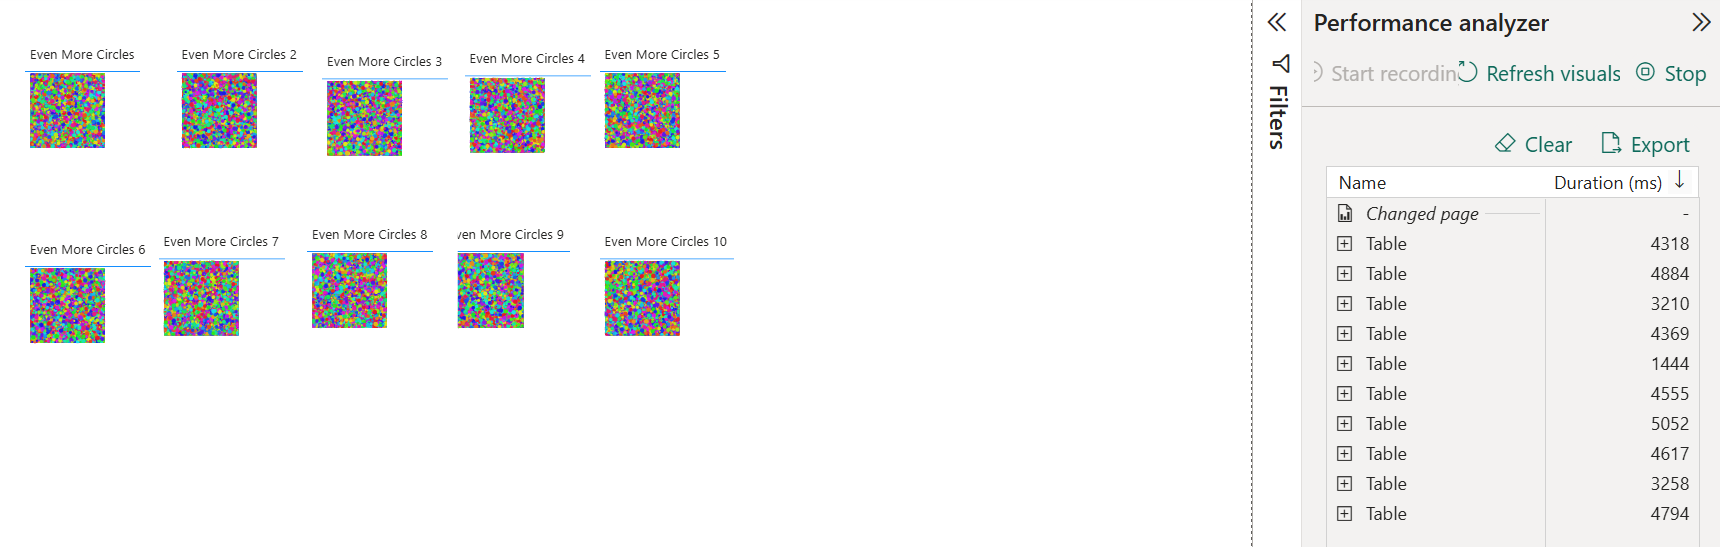
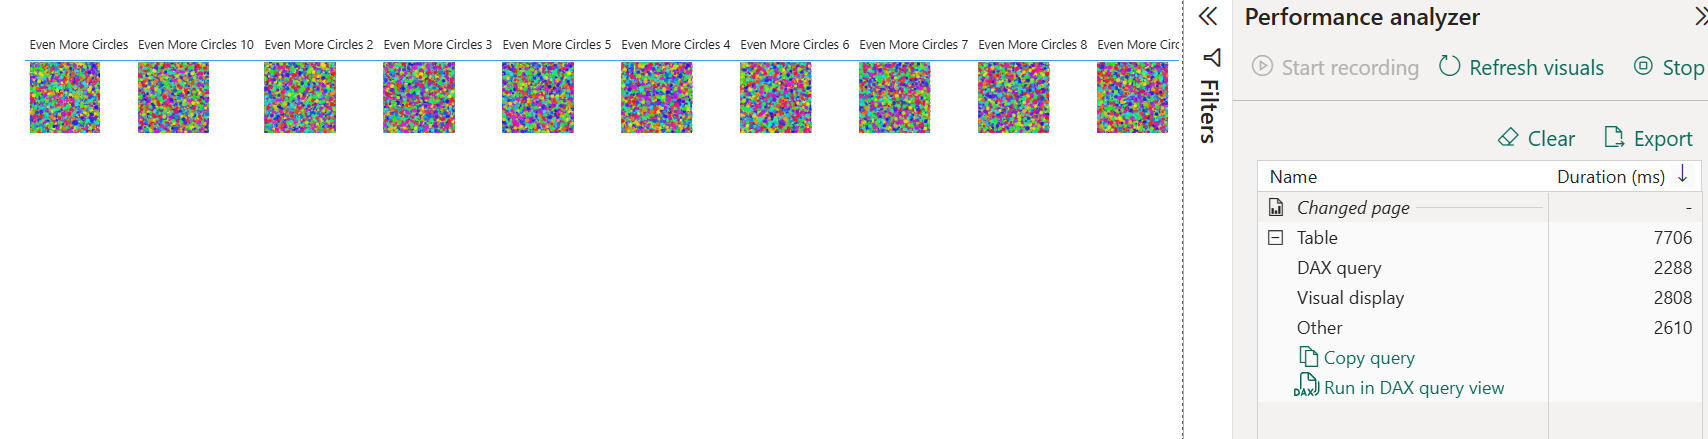
That seemed to have the required effect taking 5 seconds to render the page, although the DAX took around 400ms per table, so some level of queuing would of inflated the overall numbers. Just to cover all bases I tested the 10 measures in a single table to see what would happen, which ended up taking 7 seconds.
So the real take away is:
-
Optimize your DAX
- Round decimals
- Sample data if possible
- Limit iteration loops
-
Be sensible
- Use
<defs>and<use>to reuse elements - Don't render 1000s of objects
- Avoid animations — they re-render continuously, not just once
- Avoid complex filters like
<feTurbulence>and<feDisplacementMap> - Limit the number of SVG visuals on a page — costs compound across visuals
- Use SVGs sparingly to prompt an action, not just for visual flourish
- Use