DaxLib.SVG Compound Function Performance
Testing the query performance of DaxLib.SVG Compound functions with the DAX Performance Testing Notebook
I recently presented the daxlib.svg library on Fabric Fridays, and was asked about the performance of the function. In this post I will profile the performance of the library using the DAX Performance Testing notebook from the Fabric Toolbox.
DaxLib.SVG
DaxLib.SVG consists of a few function categories:
| Category | Description |
|---|---|
| SVG Wrapper | Wraps one or more Elements, Defs, Compounds, applying required metadata and <SVG> tags |
| Elements | SVG primitives (i.e. <Rect>, <Circle>, <line>) |
| Compounds | Complex components (i.e. boxplot, violin) made from Elements |
| Defs | Define reusable SVG elements (i.e. <linearGradient>, <clipPath>, and shapes) |
| Attributes | Create Attributes (i.e. fill, stroke, opacity) string that can be applied to Elements and Defs |
| Transforms | Create Transform strings |
| Scales | Mapping values between scales |
| Colors | Themes and functions for colour manipulation |
Compounds are the highest level abstraction, combine multiple DaxLib.SVG.Element.* into higher-level reusable components for the generation of chart visualizations. They are designed to be easy to use, while outputting complex visuals. They are the most complex and demanding functions in the library, and will be the functions I will be focusing on profiling.
Performance Testing
As a base for this testing I will use the Contoso 1 Million Row Dataset, and I will use the most recent release of library: DaxLib.SVG v0.2.2-beta.
Testing Plan
SVG's measures can be viewed in a few visuals which I will group into two categories:
| Category | Visuals | Behavior |
|---|---|---|
| Card | Image Button Slicer List Slicer |
Single function call |
| Table | Table Matrix |
Multiple function call (once per row) |
I will test each measure either as a simple measure call to simulate a card, or in SUMMARIZECOLUMNS() to simulate a table.
Most of the daxlib.svg.compound.* functions require a measureVal and xAxis parameter. The column xAxis can be datetime, numeric or string. The function will evaluate the measureVal measure for each value of the xAxis column.
For testing DaxLib.SVG.Compound.* xAxis will be 'Date'[Date] (1-Jun-2016..31-Dec-2026) and measureVal will be a simple measure [Sales Amount]. The performance of the SVG measure is going to depend greatly on the measure being evaluated. The measure will be evaluated over the given axis, so the grain of the axis will also contribute to the performance of the measure. In this case the performance could be greatly improved by instead evaluating over Year-Month. Therefore I will also test DaxLib.SVG.Compound.* with a xAxis of 'Date'[Year Month]. Finally I will evaluate [Sales Amount] as a baseline.
Measures
The tested measures are defined below.
We can check to see that the defined measure output as expected
Compound.Area =
VAR Compound =
    DaxLib.SVG.Compound.Area(
        0,              // x
        0,              // y
        100,            // width
        20,             // height
        0.05,           // paddingX
        0.02,           // paddingY
        'Date'[Date],   // xAxis
        [Sales Amount], // measureVal
        "#EC008C",      // fillColour
        0.2,            // fillOpacity
        "#EC008C"       // strokeColour
    )
RETURN

    IF(
        NOT ISBLANK( Compound ),
        DaxLib.SVG.SVG(
            100,        // width
            20,         // height
            BLANK(),
            Compound,
            BLANK()
        )
    )
Compound.Bar =
VAR Compound =
    DaxLib.SVG.Compound.Bar(
        0,              // x
        0,              // y
        100,            // width
        20,             // height
        0.05,           // paddingX
        0.04,           // paddingY
        'Date'[Date],   // xAxis
        [Sales Amount], // measureVal
        "#EC008C"       // lineColour
    )
RETURN

    IF(
        NOT ISBLANK( Compound ),
        DaxLib.SVG.SVG(
            100,        // width
            20,         // height
            BLANK(),
            Compound,
            BLANK()
        )
    )
Compound.BoxPlot =
VAR Compound =
    DaxLib.SVG.Compound.Boxplot(
        0,              // x
        0,              // y
        100,            // width
        20,             // height
        0.05,           // paddingX
        0.02,           // paddingY
        'Date'[Date],   // axisRef
        [Sales Amount], // measureVal
        "#EC008C",      // fillColour
        "#EC008C",      // strokeColour
        TRUE            // showOutliers
    )
RETURN

    IF(
        NOT ISBLANK( Compound ),
        DaxLib.SVG.SVG(
            100,        // width
            20,         // height
            BLANK(),
            Compound,
            BLANK()
        )
    )
Compound.Heatmap =
VAR Compound =
    DaxLib.SVG.Compound.Heatmap(
        0,              // x
        0,              // y
        100,            // width
        20,             // height
        0.05,           // paddingX
        0.02,           // paddingY
        'Date'[Date],   // axisRef
        [Sales Amount], // measureVal
        60,             // samples
        100,            // bandwidth
        "#EC008C"       // Colour
    )
RETURN

    IF(
        NOT ISBLANK( Compound ),
        DaxLib.SVG.SVG(
            100,        // width
            20,         // height
            BLANK(),
            Compound,
            BLANK()
        )
    )
Compound.Jitter =
VAR Compound =
    DaxLib.SVG.Compound.Jitter(
        0,              // x
        0,              // y
        100,            // width
        20,             // height
        0.05,           // paddingX
        0.02,           // paddingY
        'Date'[Date],   // xAxis
        [Sales Amount], // measureRef
        "#EC008C",      // pointColour
        0.5             // jitterAmount
    )
RETURN

    IF(
        NOT ISBLANK( Compound ),
        DaxLib.SVG.SVG(
            100,        // width
            20,         // height
            BLANK(),
            Compound,
            BLANK()
        )
    )
Compound.Line =
VAR Compound =
    DaxLib.SVG.Compound.Line(
        0,              // x
        0,              // y
        100,            // width
        20,             // height
        0.05,           // paddingX
        0.04,           // paddingY
        'Date'[Date],   // xAxis
        [Sales Amount], // measureVal
        "#EC008C"       // lineColour
    )
RETURN

    IF(
        NOT ISBLANK( Compound ),
        DaxLib.SVG.SVG(
            100,        // width
            20,         // height
            BLANK(),
            Compound,
            BLANK()
        )
    )
Compound.Violin =
VAR Compound =
    DaxLib.SVG.Compound.Violin(
        0,              // x
        0,              // y
        100,            // width
        20,             // height
        0.05,           // paddingX
        0.02,           // paddingY
        'Date'[Date],   // axisRef
        [Total Cost],   // measureVal
        60,             // samples
        400,            // bandwidth
        "#EC008C"       // color
    )
RETURN

    IF(
        NOT ISBLANK( Compound ),
        DaxLib.SVG.SVG(
            100,        // width
            20,         // height
            BLANK(),
            Compound,
            BLANK()
        )
    )
Compound.Area =
VAR Compound =
    DaxLib.SVG.Compound.Area(
        0,              // x
        0,              // y
        100,            // width
        20,             // height
        0.05,           // paddingX
        0.02,           // paddingY
        'Date'[Year Month], // xAxis
        [Sales Amount], // measureVal
        "#EC008C",      // fillColour
        0.2,            // fillOpacity
        "#EC008C"       // strokeColour
    )
RETURN

    IF(
        NOT ISBLANK( Compound ),
        DaxLib.SVG.SVG(
            100,        // width
            20,         // height
            BLANK(),
            Compound,
            BLANK()
        )
    )
Compound.Bar =
VAR Compound =
    DaxLib.SVG.Compound.Bar(
        0,              // x
        0,              // y
        100,            // width
        20,             // height
        0.05,           // paddingX
        0.04,           // paddingY
        'Date'[Year Month], // xAxis
        [Sales Amount], // measureVal
        "#EC008C"       // lineColour
    )
RETURN

    IF(
        NOT ISBLANK( Compound ),
        DaxLib.SVG.SVG(
            100,        // width
            20,         // height
            BLANK(),
            Compound,
            BLANK()
        )
    )
Compound.BoxPlot =
VAR Compound =
    DaxLib.SVG.Compound.Boxplot(
        0,              // x
        0,              // y
        100,            // width
        20,             // height
        0.05,           // paddingX
        0.02,           // paddingY
        'Date'[Year Month], // axisRef
        [Sales Amount], // measureVal
        "#EC008C",      // fillColour
        "#EC008C",      // strokeColour
        TRUE            // showOutliers
    )
RETURN

    IF(
        NOT ISBLANK( Compound ),
        DaxLib.SVG.SVG(
            100,        // width
            20,         // height
            BLANK(),
            Compound,
            BLANK()
        )
    )
Compound.Heatmap =
VAR Compound =
    DaxLib.SVG.Compound.Heatmap(
        0,              // x
        0,              // y
        100,            // width
        20,             // height
        0.05,           // paddingX
        0.02,           // paddingY
        'Date'[Year Month], // axisRef
        [Sales Amount], // measureVal
        60,             // samples
        100,            // bandwidth
        "#EC008C"       // Colour
    )
RETURN

    IF(
        NOT ISBLANK( Compound ),
        DaxLib.SVG.SVG(
            100,        // width
            20,         // height
            BLANK(),
            Compound,
            BLANK()
        )
    )
Compound.Jitter =
VAR Compound =
    DaxLib.SVG.Compound.Jitter(
        0,              // x
        0,              // y
        100,            // width
        20,             // height
        0.05,           // paddingX
        0.02,           // paddingY
        'Date'[Year Month], // xAxis
        [Sales Amount], // measureRef
        "#EC008C",      // pointColour
        0.5             // jitterAmount
    )
RETURN

    IF(
        NOT ISBLANK( Compound ),
        DaxLib.SVG.SVG(
            100,        // width
            20,         // height
            BLANK(),
            Compound,
            BLANK()
        )
    )
Compound.Line =
VAR Compound =
    DaxLib.SVG.Compound.Line(
        0,              // x
        0,              // y
        100,            // width
        20,             // height
        0.05,           // paddingX
        0.04,           // paddingY
        'Date'[Year Month], // xAxis
        [Sales Amount], // measureVal
        "#EC008C"       // lineColour
    )
RETURN

    IF(
        NOT ISBLANK( Compound ),
        DaxLib.SVG.SVG(
            100,        // width
            20,         // height
            BLANK(),
            Compound,
            BLANK()
        )
    )
Compound.Violin =
VAR Compound =
    DaxLib.SVG.Compound.Violin(
        0,              // x
        0,              // y
        100,            // width
        20,             // height
        0.05,           // paddingX
        0.02,           // paddingY
        'Date'[Year Month], // axisRef
        [Total Cost],   // measureVal
        60,             // samples
        400,            // bandwidth
        "#EC008C"       // color
    )
RETURN

    IF(
        NOT ISBLANK( Compound ),
        DaxLib.SVG.SVG(
            100,        // width
            20,         // height
            BLANK(),
            Compound,
            BLANK()
        )
    )
DAX Performance Testing Notebook
I will use the DAX Performance Testing notebook from the Fabric Toolbox to perform the testing. DAXNoob (aka Justin Martin) has a blog post on this. This is a notebook that will run various DAX queries, defined in a Excel file, under different cache states, and save the results to a Lakehouse. I ran 3 queries per measure.
Trace Start Delay
I ended up adding a delay of 10s to Trace start trace.start(delay=10)) to reduce the number of no trace log found warnings
/nfs4/pyenv-58b912cf-d895-40b8-9110-49a93f1a1230/lib/python3.11/site-packages/sempy/fabric/_trace/_trace.py:179: UserWarning: No trace logs have been recorded. Try starting the trace with a larger 'delay' parameter (default is 3 seconds)                            to allow the engine enough time to register and subscribe to the trace events.
warnings.warn("No trace logs have been recorded. Try starting the trace with a larger 'delay' parameter (default is 3 seconds)
# Define models and their configurations for testing
models = [
{
        "name": "Contoso 1M", # The name of the semantic model
        "storageMode": "Import",  # Import, DirectQuery, or DirectLake
        "cache_types": ["warm", "hot"], # List of cache types to be run (hot, warm, and cold)
        "model_workspace_name": "SVG", # The workspace name of the semantic model
        "runQueryType": "query", # The name of the column in your DAX Excel file contains the query to be run
    },
]

# Additional arguments controlling the behavior of query execution and logging
additional_arguments = {
    "roundNumber": 1, # The current round of DAX testing. Will be considered when determine if maxNumberPerQuery is met or not
    "onlyRunNewQueries": True, # Will determine if queries will stop being tested after maxNumberPerQuery is met
    "maxNumberPerQuery": 3, # The max number of queries to capture per round, queryId, model and cache type
    "maxFailuresBeforeSkipping": 3, # The number of failed query attempts per round, queryId, model and cache type before skipping
    "numberOfRunsPerQueryId": 15, # The number of times to loop over each queryId. If all combos have met maxNumberPerQuery, the loop will break
    "stopQueryIdsAt": 99, # Allows you to stop the queryId loop at a certain number, even if there are more queries present, i.e., there are queryIds 1-20 but stop at 5
    "forceStartQueriesAt1": False, # If set to False, testing will stop at the first incomplete queryId instead of starting at queryId 1
    "logTableName": "svgTesting", # The name of the table in the attached lakehouse to save the performance logs to
    "clearAllLogs": False, # Will drop the existing logs table before starting testing
    "clearCurrentRoundLogs": False, # Will delete the logs associated with the current roundNumber before starting testing
    "randomizeRuns": True, # Will randomize the model and cache type combos when testing
    "skipSettingHotCache": False, # Should be False if randomizing the runs. If the runs are randomized, the previous warm cache run will set the hot cache
    "pauseAfterSettingCache": 5, # The number of seconds to wait after setting the cache
    "pauseAfterRunningQuery": 5, # The number of second to wait before writing the logs to the log table
    "pauseBetweenRuns": 30, # The number of seconds to wait before starting the next query
}
| queryId | query |
|---|---|
| 1 | EVALUATE { [Sales Amount] } |
| 2 | EVALUATE { [Compound.Area.Date] } |
| 3 | EVALUATE { [Compound.Bar.Date] } |
| 4 | EVALUATE { [Compound.BoxPlot.Date] } |
| 5 | EVALUATE { [Compound.Heatmap.Date] } |
| 6 | EVALUATE { [Compound.Jitter.Date] } |
| 7 | EVALUATE { [Compound.Line.Date] } |
| 8 | EVALUATE { [Compound.Violin.Date] } |
| 9 | EVALUATE { [Compound.Area.YearMonth] } |
| 10 | EVALUATE { [Compound.Bar.YearMonth] } |
| 11 | EVALUATE { [Compound.BoxPlot.YearMonth] } |
| 12 | EVALUATE { [Compound.Heatmap.YearMonth] } |
| 13 | EVALUATE { [Compound.Jitter.YearMonth] } |
| 14 | EVALUATE { [Compound.Line.YearMonth] } |
| 15 | EVALUATE { [Compound.Violin.YearMonth] } |
| 16 | EVALUATE SUMMARIZECOLUMNS( Product[Brand], "foo", [Sales Amount] ) |
| 17 | EVALUATE SUMMARIZECOLUMNS( Product[Brand], "foo", [Compound.Area.Date] ) |
| 18 | EVALUATE SUMMARIZECOLUMNS( Product[Brand], "foo", [Compound.Bar.Date] ) |
| 19 | EVALUATE SUMMARIZECOLUMNS( Product[Brand], "foo", [Compound.BoxPlot.Date] ) |
| 20 | EVALUATE SUMMARIZECOLUMNS( Product[Brand], "foo", [Compound.Heatmap.Date] ) |
| 21 | EVALUATE SUMMARIZECOLUMNS( Product[Brand], "foo", [Compound.Jitter.Date] ) |
| 22 | EVALUATE SUMMARIZECOLUMNS( Product[Brand], "foo", [Compound.Line.Date] ) |
| 23 | EVALUATE SUMMARIZECOLUMNS( Product[Brand], "foo", [Compound.Violin.Date] ) |
| 24 | EVALUATE SUMMARIZECOLUMNS( Product[Brand], "foo", [Compound.Area.YearMonth] ) |
| 25 | EVALUATE SUMMARIZECOLUMNS( Product[Brand], "foo", [Compound.Bar.YearMonth] ) |
| 26 | EVALUATE SUMMARIZECOLUMNS( Product[Brand], "foo", [Compound.BoxPlot.YearMonth] ) |
| 27 | EVALUATE SUMMARIZECOLUMNS( Product[Brand], "foo", [Compound.Heatmap.YearMonth] ) |
| 28 | EVALUATE SUMMARIZECOLUMNS( Product[Brand], "foo", [Compound.Jitter.YearMonth] ) |
| 29 | EVALUATE SUMMARIZECOLUMNS( Product[Brand], "foo", [Compound.Line.YearMonth] ) |
| 30 | EVALUATE SUMMARIZECOLUMNS( Product[Brand], "foo", [Compound.Violin.YearMonth] ) |
Now we can run the notebook and the results will get saved to the mounted Lakehouse.
Results
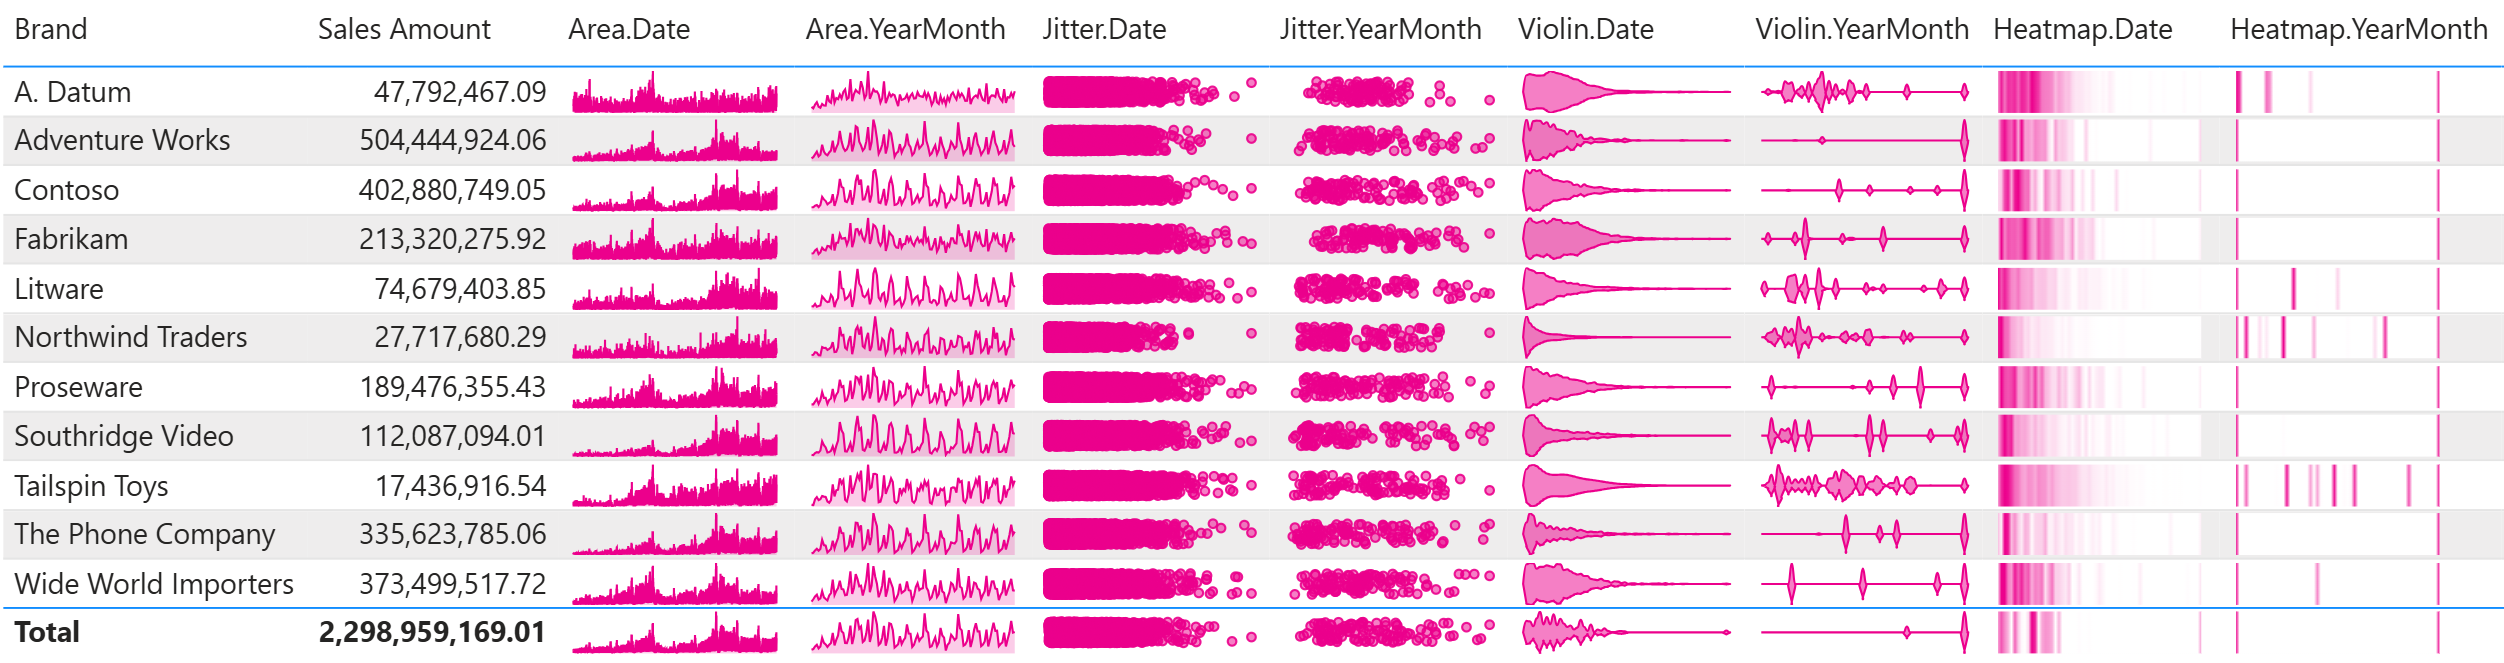
One thing to note is that the DAX Performance testing notebook is not particularly fast, it took 4 hours to process these queries. But it is automated and repeatable. Additionally the notebook counts as a background operation rather than interactive, which will make your Fabric Admin happy. The average duration per measure is shown below. For context, for the table we are evaluating the measures against 'product'[Brand], which has 11 brands.
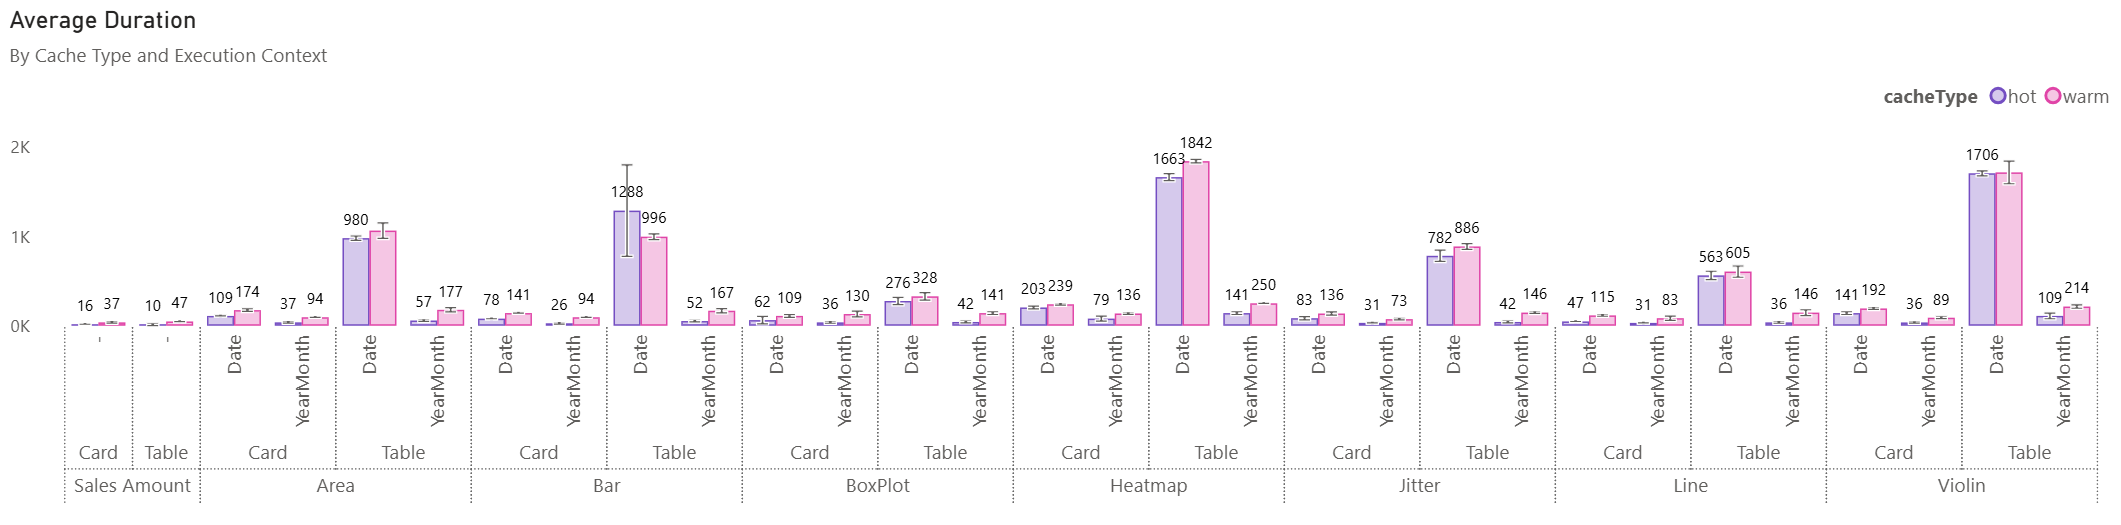
If we look at Compound, Context and Granularity we can first see that there isn't a huge difference between warm and hot cache. This hints that each measure is likely relying on a lot of Formula Engine (FE) vs Storage Engine (SE), which is not unexpected. All of the daxlib.svg.compound.* functions have a similar construction and although I have tried to calculate a data table early to aid with generating a reusable data cache, there is still a decent amount of string manipulation which will require a reasonable amount of FE involvement. Secondly we can see the impact of the choice of xAxis. The increased granularity of 'date'[Date] vs 'date'[Year Month] has a large effect for many of the daxlib.svg.compound.* functions. The Heatmap and Violin plots are the slowest, which is to be expected since they have additional processing over the other daxlib.svg.compound.* functions. They both need to sample data across the data range; see my previous blog post on SVG Violin plot for info on how and why this sampling occurs.
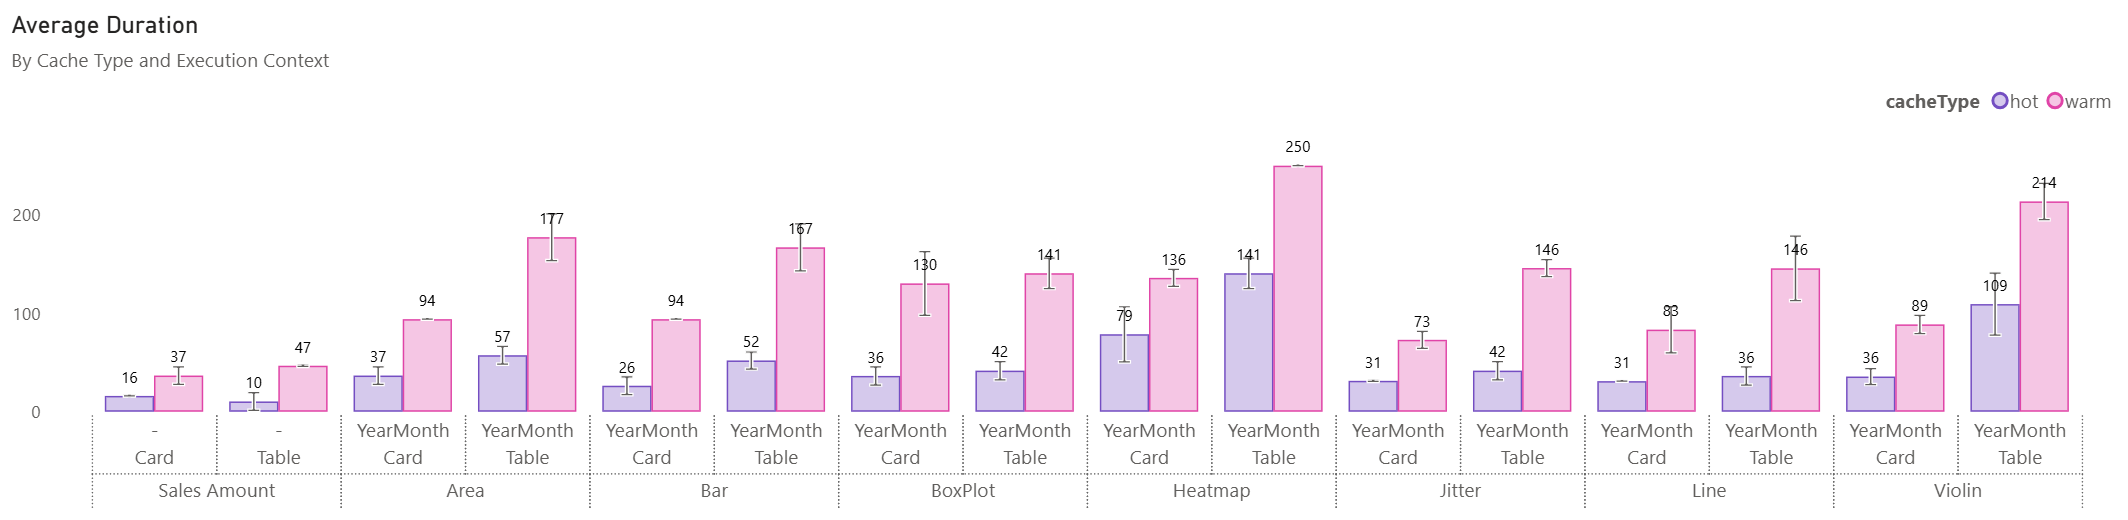
If we exclude the 'date'[Date] granularity measure, we can see the hot cache is at least 50% faster than the warm cache. Additionally the measures all return results in a range of 141-250ms in the table context, with daxlib.svg.compound.Heatmap and daxlib.svg.compound.Violin being the slowest.
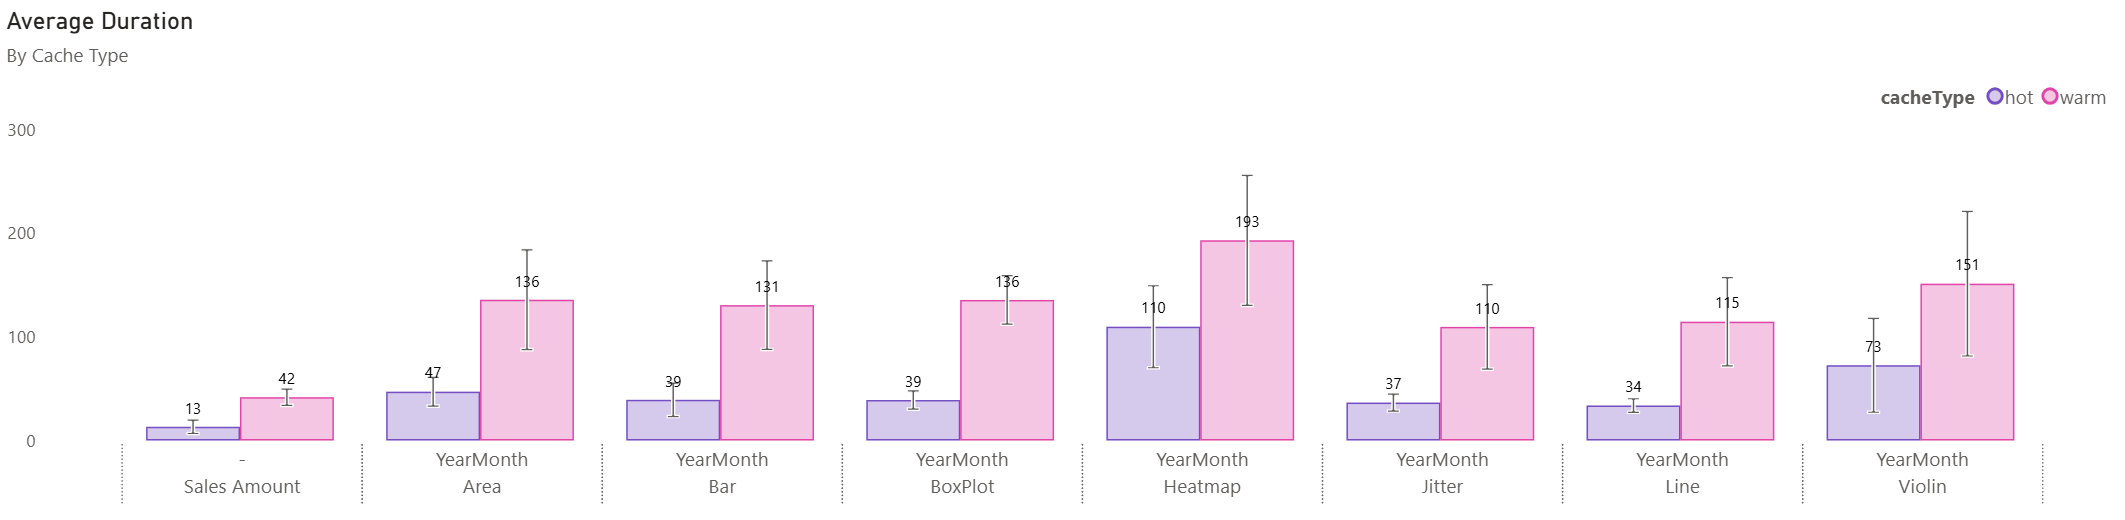
If we ignore the execution context (table and card) and sort by Average Duration, we can more easily see the speed of each daxlib.svg.compound.* function across the different scenarios.
DAX Studio
To have a closer look at the query characteristics of these functions, we can load up DAX Studio. Then we can turn on server timings, turn on clear cache on run, and have a look at queryId 30 EVALUATE SUMMARIZECOLUMNS( Product[Brand], "foo", [Compound.Violin.YearMonth] ).
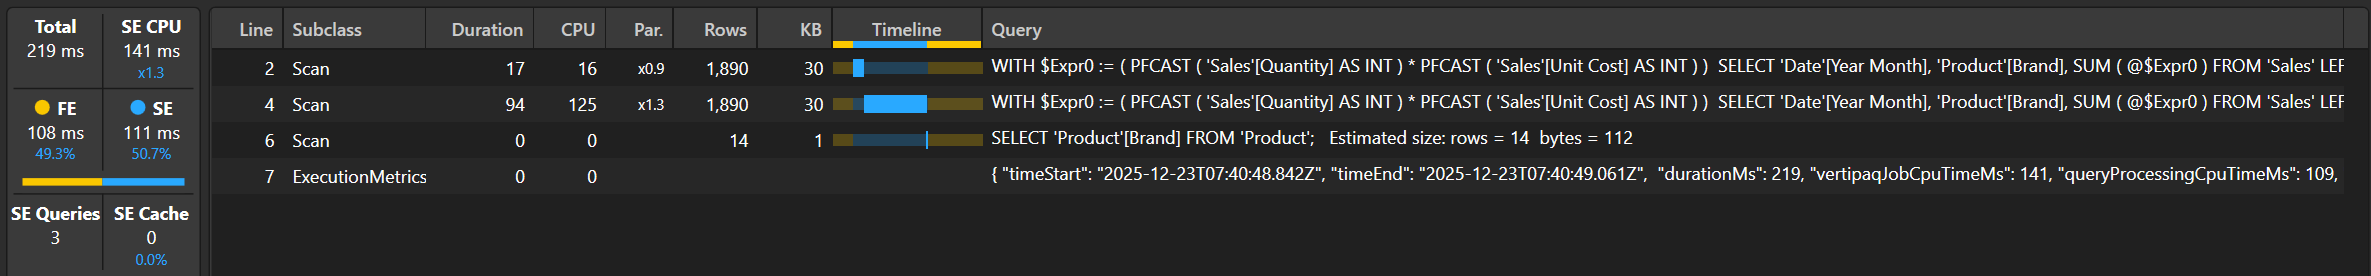
The measure has a 50% SE and 50% FE, with 3 SE queries.
The first query gets the SUM() of Sales per 'Date'[Year Month] and 'Product'[Brand], resulting in 1,890 rows, duration of 17ms and CPU of 16ms. This likely the generation of the initial cache to calculate the min and max data range to allow mapping from the data scale to the visual scale.
WITH
    $Expr0 := ( PFCAST ( 'Sales'[Quantity] AS INT ) * PFCAST ( 'Sales'[Unit Cost] AS INT ) )
SELECT
    'Date'[Year Month],
    'Product'[Brand],
    SUM ( @$Expr0 )
FROM 'Sales'
    LEFT OUTER JOIN 'Date'
        ON 'Sales'[Order Date]='Date'[Date]
    LEFT OUTER JOIN 'Product'
        ON 'Sales'[ProductKey]='Product'[ProductKey];
Followed by a similar query but with tuple firsts on 'Date'[Year Month] and 'Product'[Brand], returning the same number of rows, but with a duration of 94ms and CPU of 125ms.
SET DC_KIND="AUTO";
WITH
    $Expr0 := ( PFCAST ( 'Sales'[Quantity] AS INT ) * PFCAST ( 'Sales'[Unit Cost] AS INT ) )
SELECT
    'Date'[Year Month],
    'Product'[Brand],
    SUM ( @$Expr0 )
FROM 'Sales'
    LEFT OUTER JOIN 'Date'
        ON 'Sales'[Order Date]='Date'[Date]
    LEFT OUTER JOIN 'Product'
        ON 'Sales'[ProductKey]='Product'[ProductKey]
WHERE
     ( 'Product'[Brand], 'Date'[Year Month] ) IN { ( 'Contoso', 'December 2025' ) , ( 'Wide World Importers', 'July 2020' ) , ( 'Proseware', 'September 2025' ) , ( 'A. Datum', 'April 2020' ) , ( 'Tailspin Toys', 'September 2020' ) , ( 'Adventure Works', 'November 2024' ) , ( 'Southridge Video', 'June 2019' ) , ( 'Litware', 'April 2025' ) , ( 'Fabrikam', 'November 2019' ) , ( 'Tailspin Toys', 'August 2024' ) ..[1,276 total tuples, not all displayed]};
Then the last is a simple one to get the distinct 'Product'[Brand] for filtering the second query to plot the table.
The other daxlib.svg.compound.* have a similar profile.
Conclusion
SVGs are a fantastic storytelling tool in Power BI, but should be used for impact and sparingly, both from a visual design and performance viewpoint. With DaxLib libraries so easy to install, you can test the performance for your specific model and determine if it is acceptable for your use-case. Overall I'm reasonably happy with the performance characteristics of these functions. I have plans to try out MCP Server: DAX Performance Tuner in a future post to see if it can find any avenues for improvements.