Minimizing SVG Strings to Avoid Hitting Power BI Memory Limits
Minimizing SVG Strings to Avoid Hitting Power BI Memory Limits
When working with visuals in Power BI, SVGs offer great flexibility for creating engaging graphics in cards and tables. However, it's essential to be mindful of the limitations related to string size. This post delves into effective strategies for minimizing SVG size, particularly when handling repetitive elements. String reduction techniques are valuable tool in lowering the memory overhead of SVG visuals.
String Memory Error
I opened up my report the other day and was greeting with this error.
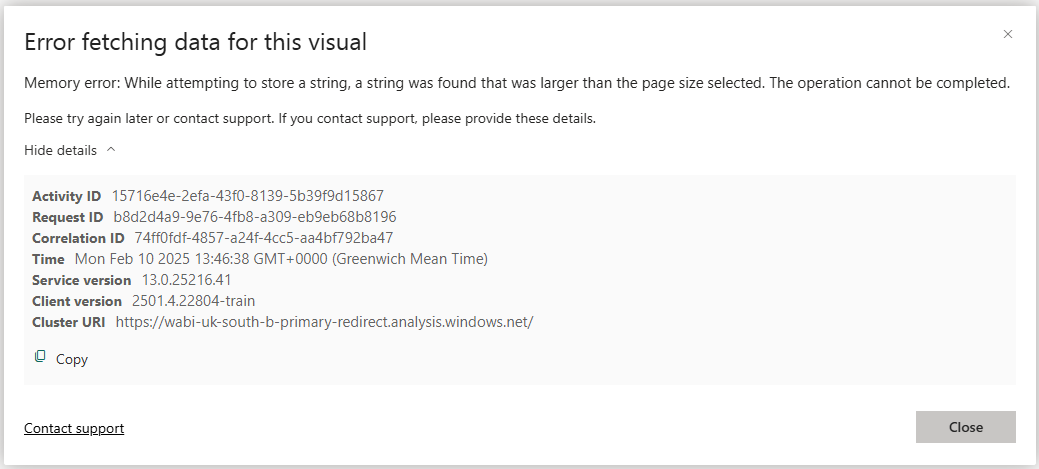
The visual in question was the following.
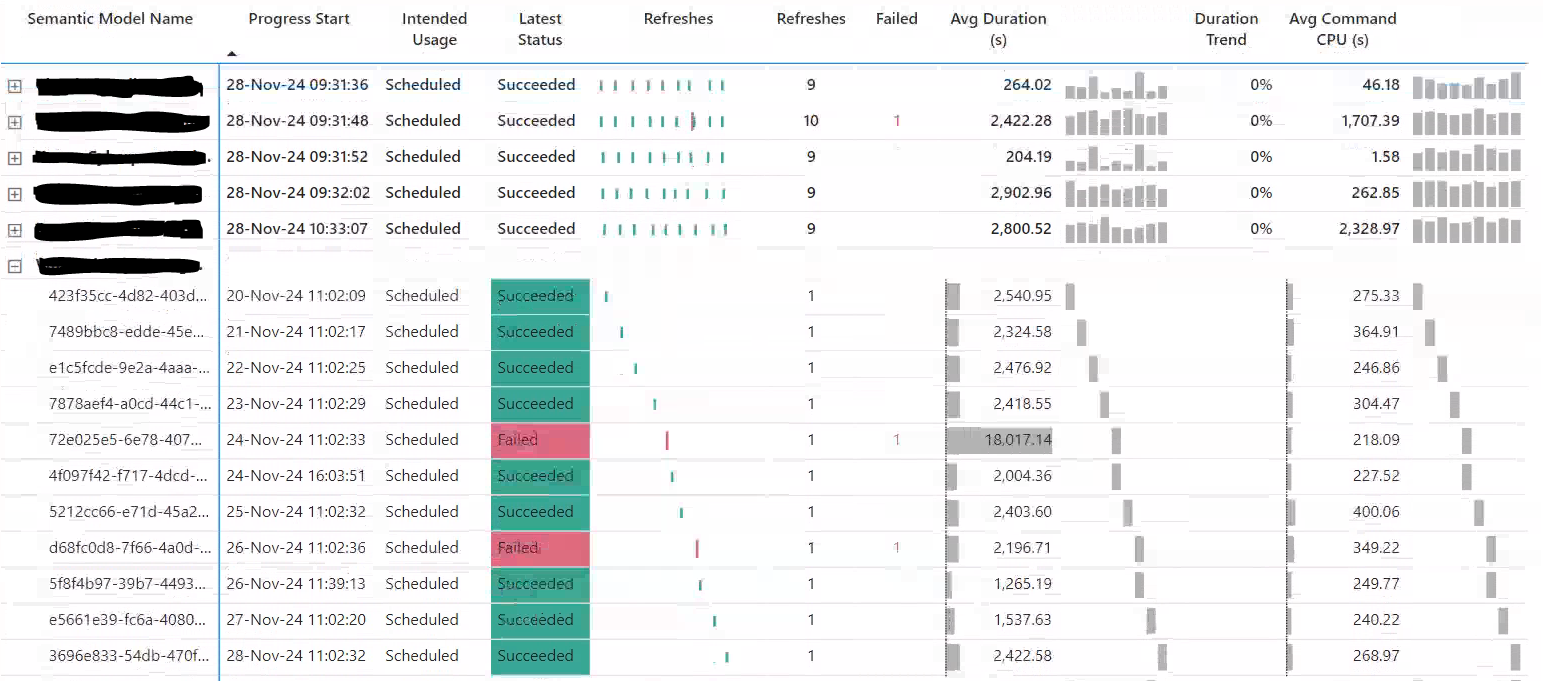
The error was caused by the Refresh Barcode SVG measure below. It creates a SVG, plotting Semantic Model refreshes as a coloured line, signifying success or failure.
MEASURE '_measures'[Refresh Barcode SVG] =
VAR __svgHeight = 20
VAR __svgWidth = 150
VAR __Categories = SUMMARIZE( 'Progress Report', 'DateTimes'[Date], 'DateTimes'[DateTime], 'Progress Report'[XmlaRequestId] )
VAR __Data =
    TOPN(
        400
        ,ADDCOLUMNS(
            KEEPFILTERS(
                FILTER(
                    KEEPFILTERS( __Categories ),
                    not ISBLANK( CALCULATE ( MAX( 'Execution Metrics'[Status] ) ) )
                )
            ),
            "Value", CALCULATE ( MAX( 'Execution Metrics'[Status] ) )
        )
        ,'DateTimes'[DateTime]
        ,DESC
    )
VAR __All_Categories =
    CALCULATETABLE(
        FILTER(
            KEEPFILTERS( SUMMARIZE( 'Progress Report', 'DateTimes'[Date], 'DateTimes'[DateTime] ) ),
            not ISBLANK( CALCULATE ( MAX( 'Execution Metrics'[Status] ) ) ) && not ISBLANK( 'DateTimes'[Date] )
        ),
        ALLSELECTED()
    )
VAR __MinX_Value = MINX( __All_Categories, 'DateTimes'[DateTime] )
VAR __MaxX_Value = MAXX( __All_Categories, 'DateTimes'[DateTime] )
VAR __RangeX = __MaxX_Value - __MinX_Value
VAR __Lines =
    CONCATENATEX(
        __Data,
        VAR __Value =
            SWITCH(
                [Value]
                ,"Started", 1
                ,"Succeeded", 0.7
                ,"Failed", 0.85
                ,0
            )
        VAR _Hex =
            SWITCH(
                [Value]
                ,"Started","#FFB900"        // Orange
                ,"Failed", "#DD6B7F"        // Red
                ,"Succeeded", "#37A794"     // Green
                ,"gray"
            )
        VAR _x = FORMAT( DIVIDE( 'DateTimes'[DateTime] - __MinX_Value, __RangeX, 0 ) * 100, "0.0", "en-US" )
        RETURN
        "<line x1='" & _x & "' y1='" & __svgHeight * __Value & "' x2='" & _x & "' y2='" & __svgHeight - (__svgHeight * __Value) & "' stroke='" & _Hex & "' stroke-width='2' />"
        ,",", [value], ASC
    )
VAR __Svg =
    "data:image/svg+xml;utf8, <svg width=""" & __svgWidth & """ height=""" & __svgHeight &""" xmlns="http://www.w3.org/2000/svg">" &
    __Lines &
    "</svg>"
RETURN
IF( not ISEMPTY(__Data) , __Svg )
From the error, it looks like the length of the string for the SVG is exceeding Power BI's memory limits. To resolve this error we could reduce the data, by Filtering or Sampling. As you can see, I am already using TOPN() to filter to 400 most recent refreshes. Sampling is the approach used Power BI's built in sparklines. Another approach, to avoid reducing data would be to reduce the size of strings required to represent the data marks, this is the approach I'll be looking at in this post.
The bulk of this SVG is the large number of <line> elements being calculated in __Lines. Which when resolved, end up looking like this:
<line x1='1' y1='2.5' x2='1' y2='7.5' stroke='#37A794"' stroke-width='2'/>
...
<line x1='150' y1='2.5' x2='150' y2='7.5' stroke='#37A794"' stroke-width='2'/>
The nth element costs us 78 characters,can we do better than that?
Swap <line> to <path>
The first thing we can look at is the type of element using to represent the lines. We could swap <line> to <path>.
<path d='M1,2.5 L2,7.5' stroke='#37A794' stroke-width='2'/>
...
<path d='M150,2.5 L150,7.5' stroke='#37A794' stroke-width='2'/>
This approach reduces the size of our nth mark to 63 characters, a 19.2% reduction.
Use <defs> and <use>
We can notice that is duplication of variables used to define formatting for the line's color and width. Can we we define a style that we can reuse for each mark? Yes we can use the <use> element. If we first use <defs> to define each mark types (failed, succeed ...) properties then we can reference it and only apply variables we want to overwrite, in this case just the x position of the mark.
<defs>
    <path id="L1" d="M1,1 L1,9" stroke='#37A794' stroke-width='2'/>
</defs>
<use href="#L1" x="1"/>
...
<use href="#L1" x="150"/>
We can see in the nth element we are now down to 25 characters, a 67.9% reduction.
Implementing
I can now update the measure with this new pattern
MEASURE '_measures'[Refresh Barcode SVG] =
VAR __svgHeight = 20
VAR __svgWidth = 150
VAR __Categories = SUMMARIZE( 'Progress Report', 'DateTimes'[Date], 'DateTimes'[DateTime], 'Progress Report'[XmlaRequestId] )
VAR __Data =
    TOPN(
        400
        ,ADDCOLUMNS(
            KEEPFILTERS(
                FILTER(
                    KEEPFILTERS( __Categories ),
                    not ISBLANK( CALCULATE ( MAX( 'Execution Metrics'[Status] ) ) )
                )
            ),
            "Value", CALCULATE ( MAX( 'Execution Metrics'[Status] ) )
        )
        ,'DateTimes'[DateTime]
        ,DESC
    )
VAR __All_Categories =
    CALCULATETABLE(
        FILTER(
            KEEPFILTERS( SUMMARIZE( 'Progress Report', 'DateTimes'[Date], 'DateTimes'[DateTime] ) ),
            not ISBLANK( CALCULATE ( MAX( 'Execution Metrics'[Status] ) ) ) && not ISBLANK( 'DateTimes'[Date] )
        ),
        ALLSELECTED()
    )
VAR __MinX_Value = MINX( __All_Categories, 'DateTimes'[DateTime] )
VAR __MaxX_Value = MAXX( __All_Categories, 'DateTimes'[DateTime] )
VAR __RangeX = __MaxX_Value - __MinX_Value
VAR __Lines =
    CONCATENATEX(
        __Data,
        VAR __def =
            SWITCH(
                [Value]
                ,"Started",     "#L1"
                ,"Failed",      "#L2"
                ,"Succeeded",   "#L3"
                ,0
            )
        VAR _x = FORMAT( DIVIDE( 'DateTimes'[DateTime] - __MinX_Value, __RangeX, 0 ) * 100, "0.0", "en-US" )
        RETURN
        "<use href='" & __def & "' x='" & _x & "'/>"
        ,",", [value], ASC
    )
VAR __Svg =
    "data:image/svg+xml;utf8, <svg width='" & __svgWidth & "' height='" & __svgHeight & "' xmlns="http://www.w3.org/2000/svg">" &
    "<defs>" &
        "<path id='L1' d='M1," & __svgHeight * 1    & " L1," & __svgHeight - (__svgHeight * 1)    & "' stroke='#FFB900' stroke-width='2'/>" & // Started Orange
        "<path id='L2' d='M1," & __svgHeight * 0.85 & " L1," & __svgHeight - (__svgHeight * 0.85) & "' stroke='#DD6B7F' stroke-width='2'/>" & // Failed Red
        "<path id='L3' d='M1," & __svgHeight * 0.7  & " L1," & __svgHeight - (__svgHeight * 0.7)  & "' stroke='#37A794' stroke-width='2'/>" & // Succeeded Green
    "</defs>" &
    __Lines &
    "</svg>"
RETURN
IF( not ISEMPTY(__Data) , __Svg )
Conclusion
By swapping from <line> to <path> and using <defs> and <use> I was able to reduce the size of the mark definitions 67.9%. This allows for more marks per SVG before hitting Power BI's memory limits. I would also argue it is slightly more readable. I believe this approach should be used regardless of if memory limits are hit to reduce the memory overhead of SVG visuals.