Vertipaq Analyzer, Deep Dive
Exploring how Semantic Link Labs and SQLBI's Vertipaq Analyzers work
Vertipaq Analyzer, a powerful tool widely utilized in DAX Studio for enhancing Power BI Semantic Models. Recently, Semantic Link Labs has introduced their own version of Vertipaq Analyzer. But how does each version work, and how similar are they?
Vertipaq Analyzer
Vertipaq Analyzer is a C# package, which connects to a Power BI Semantic Model and extracts the models schema and metrics. It is included in DAX studio and has been the cornerstone of Tabular Model optimization for years.
More recently Semantic Link Labs released a vertipaq_analyzer() function.
Both versions use Dynamic Management Views (DMVs) provided by Analysis Services to collect model metrics.
Dynamic Management Views (DMVs)
Microsoft Docs: Analysis Service
Analysis Services Dynamic Management Views (DMVs) are queries that return information about model objects, server operations, and server health. The query, based on SQL, is an interface to schema rowsets. Schema rowsets are predescribed tables that contain information about Analysis Services objects and server state, including database schema, active sessions, connections, commands, and jobs that are executing on the server.
You are able to call these DMVs via the XMLA endpoint, most commonly via DAX Studio or SQL Server Management Studio (SSMS), in a SQL-like format.
With the introduction of the INFO DAX functions they can also be accessed in DAX Query View in Power BI.
Interestingly, If you look at the documentation you'll see there are two protocols for the DMVs, MS-SSAS for multidimensional models and tabular models at the 1100 and 1103 compatibility levels, and MS-SSAS-T for Tabular Models at the 1200 and higher compatibility levels, for pre and post release of Tabular Object Model (TOM).
Since the MS-SSAS protocol was built for Multidimensional models, you will notice the results sets will map Tabular attributes to fields like CUBE_NAME and MEASURE_GROUP_NAME. Additionally some processing is required to extract object names and IDs.
| DATABASE_NAME | CUBE_NAME | MEASURE_GROUP_NAME | PARTITION_NAME | DIMENSION_NAME | TABLE_ID | COLUMN_ID | SEGMENT_NUMBER | TABLE_PARTITION_NUMBER | RECORDS_COUNT | ... |
|---|---|---|---|---|---|---|---|---|---|---|
| cc5fdef3-032a-4b36-b9fd-e47565c4001d | Model | Calendar | Calendar-3114231e-ebec-4885-9c88-30dce2c6eb92 | Calendar | H$Table (1110)$Date (1161) | POS_TO_ID | 0 | 0 | 0 | ... |
| cc5fdef3-032a-4b36-b9fd-e47565c4001d | Model | Calendar | Calendar-3114231e-ebec-4885-9c88-30dce2c6eb92 | Calendar | H$Table (1110)$Date (1161) | POS_TO_ID | 1 | 0 | 0 | ... |
| cc5fdef3-032a-4b36-b9fd-e47565c4001d | Model | Calendar | Calendar-3114231e-ebec-4885-9c88-30dce2c6eb92 | Calendar | H$Table (1110)$Date (1161) | ID_TO_POS | 0 | 0 | 0 | ... |
While the MS-SSAS-T harmonize more with TOM. You will note all the DMVs for this protocol are prefixed "TM".
| ID | ColumnID | Name | StoragePosition | DictionaryStorageID | Settings | ColumnFlags | Collation | OrderByColumn | Locale | ... |
|---|---|---|---|---|---|---|---|---|---|---|
| 68 | 13 | RowNumber 2662979B 1795 4F74 8F37 6A1BA8059B61 (13) | 0 | 69 | 1 | 31 | 1033 | ... | ||
| 271 | 125 | DateTime (125) | 1 | 272 | 1 | 8 | 1033 | ... | ||
| 303 | 133 | TestID (133) | 2 | 304 | 1 | 8 | 1033 | ... |
Semantic Link Labs
Since it is the new kid on the block, and written in python, I first looked at Semantic Link Labs.
vertipaq_analyzer(dataset: str | UUID, workspace: str | UUID | None = None, export: str | None = None, read_stats_from_data: bool = False, **kwargs)
The Docstring is as follows:
def vertipaq_analyzer(
    dataset: str | UUID,
    workspace: Optional[str | UUID] = None,
    export: Optional[str] = None,
    read_stats_from_data: bool = False,
    **kwargs,
):
    """
    Displays an HTML visualization of the Vertipaq Analyzer statistics from a semantic model.

    Parameters
    ----------
    dataset : str | uuid.UUID
        Name or ID of the semantic model.
    workspace : str| uuid.UUID, default=None
        The Fabric workspace name or ID in which the semantic model exists.
        Defaults to None which resolves to the workspace of the attached lakehouse
        or if no lakehouse attached, resolves to the workspace of the notebook.
    export : str, default=None
        Specifying 'zip' will export the results to a zip file in your lakehouse (which can be imported using the import_vertipaq_analyzer function.
        Specifying 'table' will export the results to delta tables (appended) in your lakehouse.
        Default value: None.
    read_stats_from_data : bool, default=False
        Setting this parameter to true has the function get Column Cardinality and Missing Rows using DAX (Direct Lake semantic models achieve this using a Spark query to the lakehouse).
    """
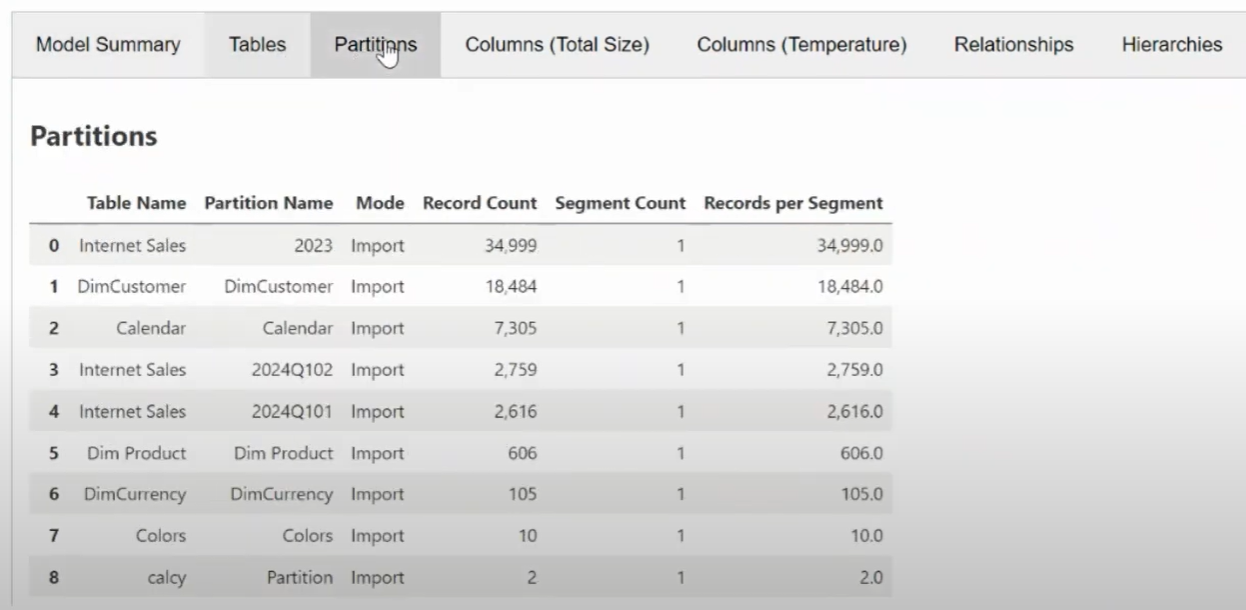
If you call vertipaq_analyzer() in a notebook it will display the results in a HTML visualization.
If you set export to 'zip' or 'table' you can instead save the result as a zip folder or delta table, to a connected lakehouse.
If we set read_stats_from_data to True additional fields for column cardinality and missing rows are returned. This is achieved by a DAX query COUNT(DISTINCT(table[column])). If the model is Direct Lake mode, spark queries are used instead.
Direct Lake - Distinct Count
Michael Kovalsky informed me that in the Direct Lake case, Semantic Links Labs implementation is preferable to SQLBIs. When a DAX query runs on Direct Lake model, columns have to be paged into memory. Since we are querying every column to perform a distinct count, pulling every column sequentially into memory, this can be a very intensive operation, and can and has crashed customer's capacities. Using spark queries, the semantic model is bypassed, and the lakehouse is queried directly, avoiding this issue.
If we go to GitHub we can see how this is implemented, for simplicity I'm going to skip the DirectLake parts.
It first connects to TOM to get some model attributes.
with connect_semantic_model(
        dataset=dataset_id, workspace=workspace_id, readonly=True
    ) as tom:
        compat_level = tom.model.Model.Database.CompatibilityLevel
        is_direct_lake = tom.is_direct_lake()
        def_mode = tom.model.DefaultMode
        table_count = tom.model.Tables.Count
        column_count = len(list(tom.all_columns()))
It then gathers the required metrics for various TOM entities. Columns, hierarchies and partitions are directly derived from sempy.
columns =           sempy.fabric.list_columns(dataset=dataset_id, extended=True, workspace=workspace_id)
hierarchies =       sempy.fabric.list_hierarchies(dataset=dataset_id, extended=True, workspace=workspace_id)
partitions =        sempy.fabric.list_partitions(dataset=dataset_id, extended=True, workspace=workspace_id)
Tables and relationships use sempy to get a list of items, which are enriched with metrics from the DMVs and DAX INFO functions. Lets look at these in more detail.
Tables
Firstly dictionary sizes per column are obtained, and summed per table.
EVALUATE
SELECTCOLUMNS(
    FILTER(
        INFO.STORAGETABLECOLUMNS(),
        [COLUMN_TYPE] = "BASIC_DATA"
    ),
    [DIMENSION_NAME],
    [DICTIONARY_SIZE]
)
It gets the sizes sizes of Tables, Hierarchies, Relationships and User Hierarchies.
EVALUATE
SELECTCOLUMNS(
    INFO.STORAGETABLECOLUMNSEGMENTS(),
    [TABLE_ID],
    [DIMENSION_NAME],
    [USED_SIZE]
)
Then aggregates with SUM [USED_SIZE] GROUP BY [DIMENSION_NAME], [USED_SIZE] for Data Size (WHERE NOT RLIKE r'(R\$|U\$|H\$).*'), Hierarchy Size (WHERE RLIKE r'H\$.*'), Relationship Size (WHERE RLIKE r'R\$.*') and User Hierarchy Size (WHERE RLIKE r'U\$.*').
Finally it gets the Row Counts per Table.
SELECT
[DIMENSION_NAME],
[ROWS_COUNT]
FROM $SYSTEM.DISCOVER_STORAGE_TABLES
WHERE RIGHT ( LEFT ( TABLE_ID, 2 ), 1 ) <> '$'
Additionally it also returns descriptions, table types, refresh policies etc from TOM, but only a few of those are surfaced by vertipaq_analyzer().
Relationships
Firstly fabric.list_relationships() provides a list of all relationships.
Then relationshipId is obtained to allow for a JOIN.
Then the storage size of relationship (where TABLE_ID starts with R$),
The list of relationships are finally joined to their sizes ON relationshipId.
Model
Finally some overall Model metrics are derived from the above: Table Count, Column Count, Total Size etc.
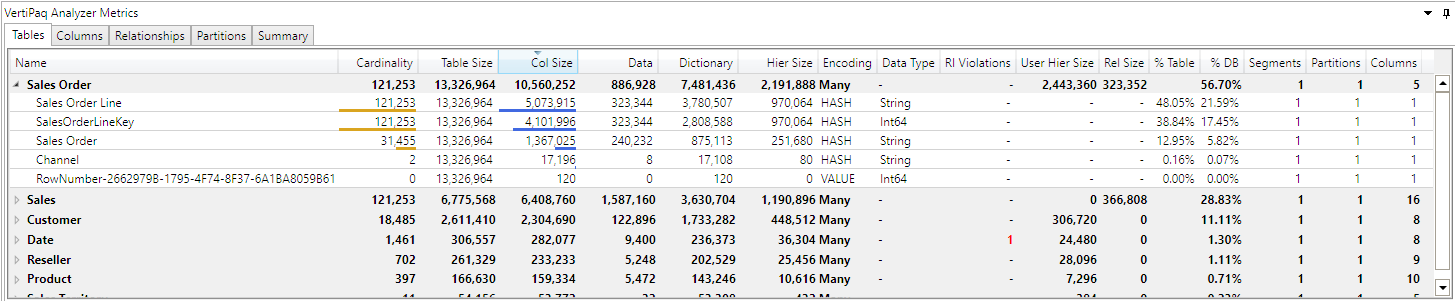
VertiPaq-Analyzer
We can now have a look at the c# version by SQLBI.
Dax.Metadata holds a representation of the Tabular model, including stats obtained from DMVs, which are populated by Dax.Model.Extractor.
Within Dax.Model.Extractor there are three files of interest TomExtractor.cs, DmvExtractor.cs and StatExtractor.cs.
TomExtractor.csusesMicrosoft.AnalysisServices.Tabularto extract model metadata to populateDax.MetadataDmvExtractor.cscalls DMVs to add additional metrics toDax.Metadata. This is called fromTomExtractor.csStatExtractor.cscalls DAX queries to get additional metrics, like Cardinality, MissingKeys etc. This is called fromTomExtractor.cs
We can see StatExtractor.cs in action if we take LoadColumnStatistics() as an example. We can see a DAX query is constructed to perform a DISTINCTCOUNT() on each column to determine cardinality.
private void LoadColumnStatistics(bool analyzeDirectQuery, DirectLakeExtractionMode analyzeDirectLake, int columnBatchSize)
        {
            var allColumns =
                (from t in DaxModel.Tables
                 // skip direct query tables if the analyzeDirectQuery is false
                 where t.Columns.Count > 1 && (analyzeDirectQuery || !t.HasDirectQueryPartitions)
                     from c in t.Columns
                     where c.State == "Ready" && !c.IsRowNumber
                        // only include the column if the table does not have Direct Lake partitions or if they are resident or if analyzeDirectLake is true
                        && (!t.HasDirectLakePartitions
                            || (analyzeDirectLake >= DirectLakeExtractionMode.ResidentOnly && c.IsResident)
                            || (analyzeDirectLake >= DirectLakeExtractionMode.Referenced && c.IsReferenced )
                            || (analyzeDirectLake == DirectLakeExtractionMode.Full)
                            )
                     select c).ToList();
            var loopColumns = allColumns.SplitList(columnBatchSize); // no more than 9999
            foreach ( var columnSet in loopColumns ) {
                var idString = 0;
                var dax = "EVALUATE ";
                //only union if there is more than 1 column in the columnSet
                if (columnSet.Count > 1) { dax += "UNION("; }
                dax += string.Join(",", columnSet
                    .Select(c => $"\n    ROW(\"Table\", \"{idString++:0000}{EmbedNameInString(c.Table.TableName.Name)}\", \"Column\", \"{idString++:0000}{EmbedNameInString(c.ColumnName.Name)}\", \"Cardinality\", {DistinctCountExpression(c)})").ToList());
                //only close the union call if there is more than 1 column in the columnSet
                if (columnSet.Count > 1) { dax += ")"; }

                var cmd = CreateCommand(dax);
                cmd.CommandTimeout = CommandTimeout;

                using (var reader = cmd.ExecuteReader()) {
                    while (reader.Read()) {
                        var tableName = reader.GetString(0).Substring(4);
                        var columnName = reader.GetString(1).Substring(4);
                        var cardinality = reader.IsDBNull(2) ? 0 : reader.GetInt64(2);

                        var column = DaxModel.Tables.Single(t => t.TableName.Name == tableName)
                                    .Columns.Single(c => c.ColumnName.Name == columnName);

                        column.ColumnCardinality = cardinality;
                    }
                }
            }
        }
Conclusion
Both flavours of Vertipaq Analyzer leverage Analysis Services DMVs to get the Semantic Models metrics. SQLBI's version is battle warn, and been the gold standard for many years. It is also convenient as it part of DAX Studio. Semantic Link Labs avoids the use of external tools, and is convenient for Fabric users. Plus it better handles the cardinality checks on Direct Lake models. With the recent addition of the VertiPaq Analyzer CLI, both options can now be used to script the analysis of a large number of models. Great thanks goes to the creators and maintainers, it looks like alot of time and effort has gone into initial development and continued support.