DaxLib.SVG 0.2.3
DaxLib.SVG v0.2.3-beta release
DaxLib.SVG v0.2.3-beta release
Using the DAX Performance Tuner MCP Server to improve the performance of the Daxlib.SVG.Compound.Violin() function

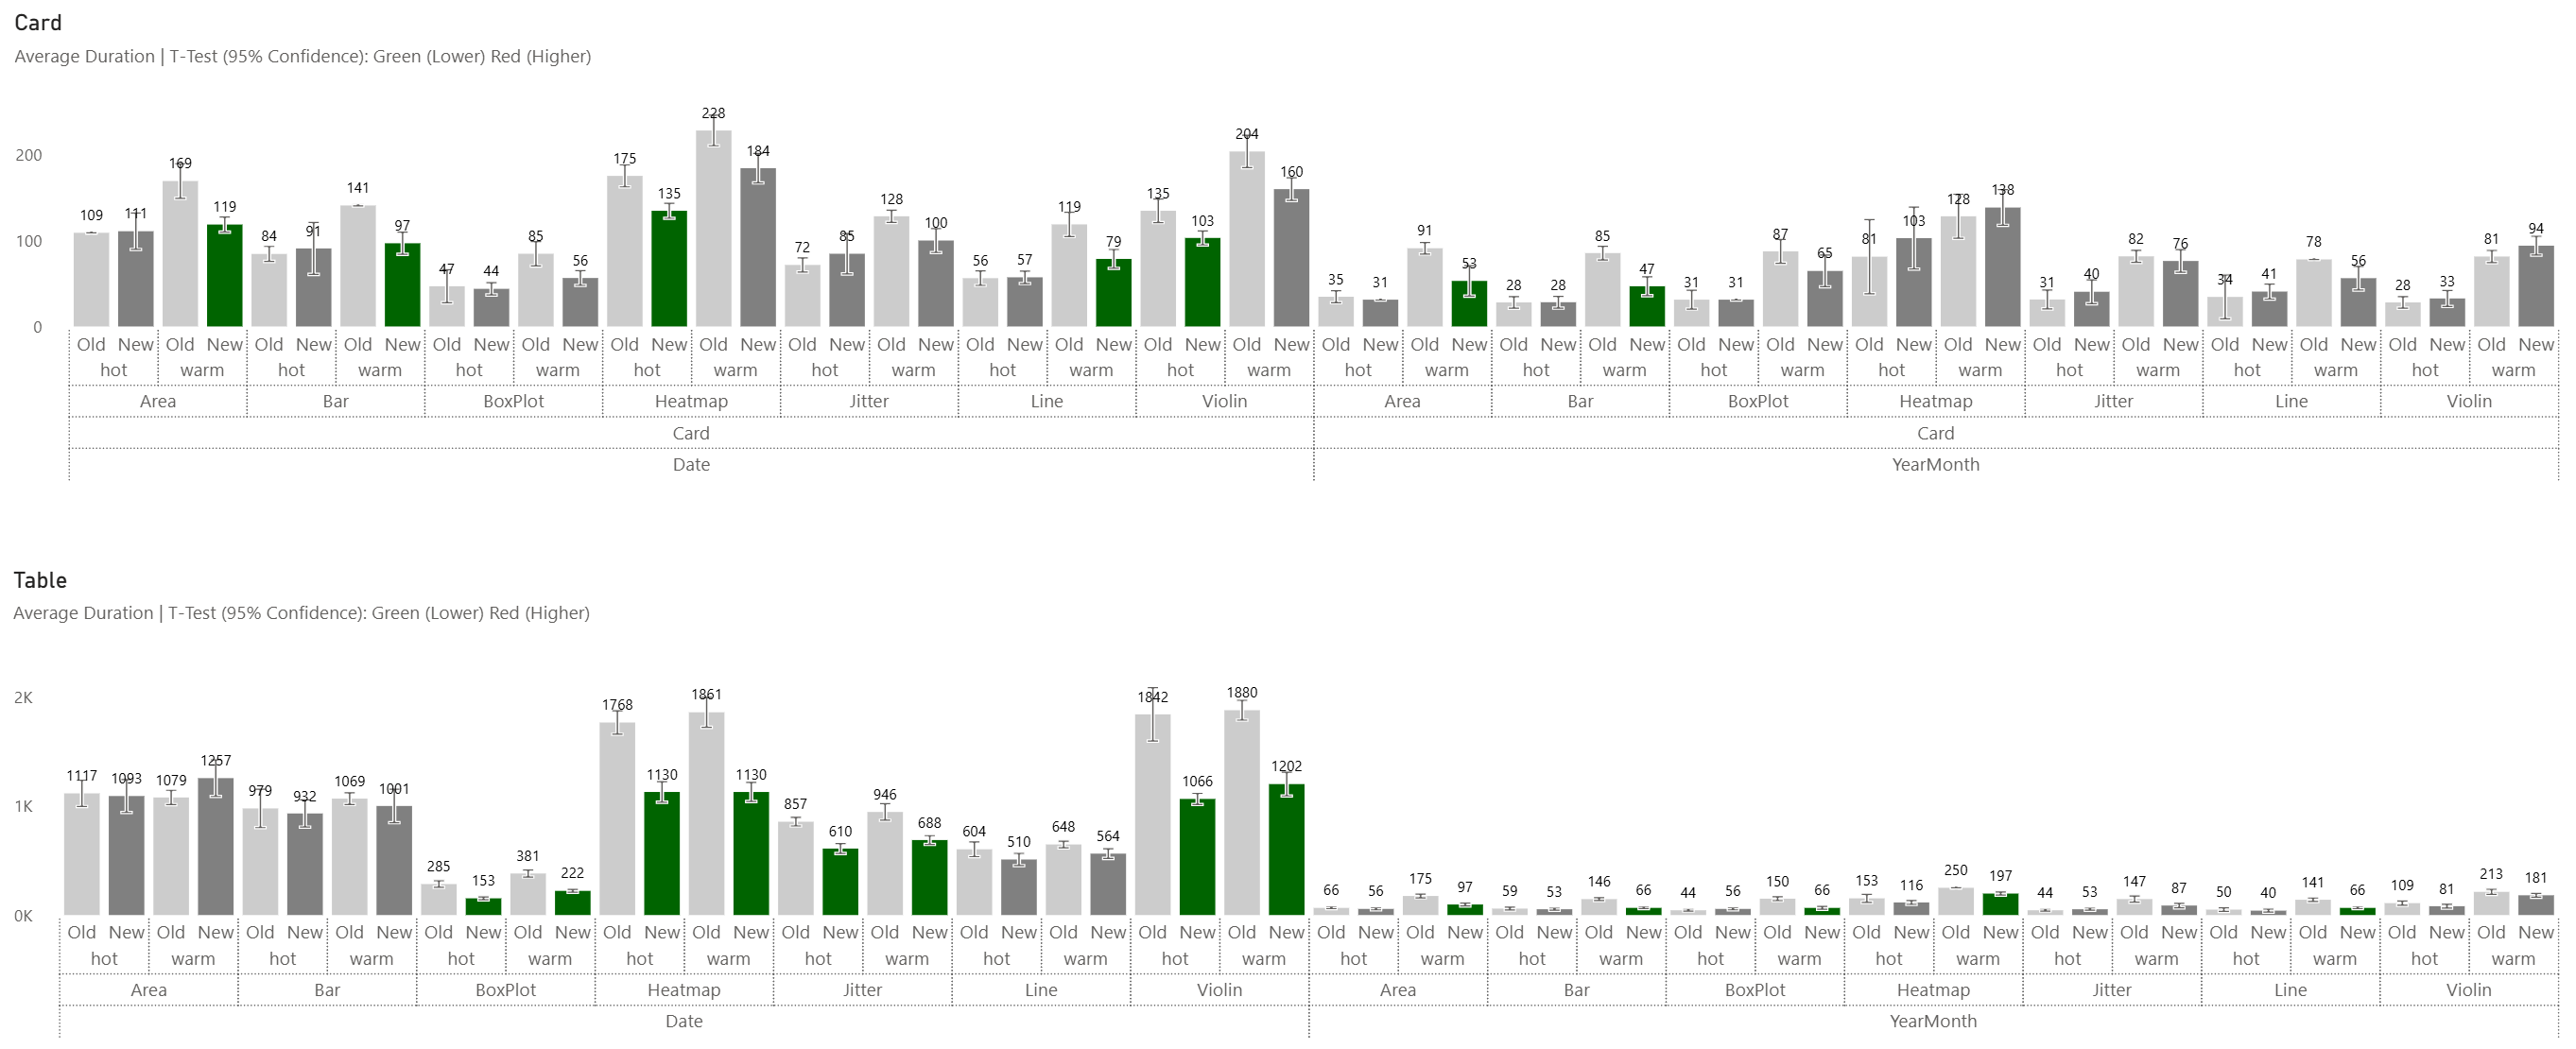
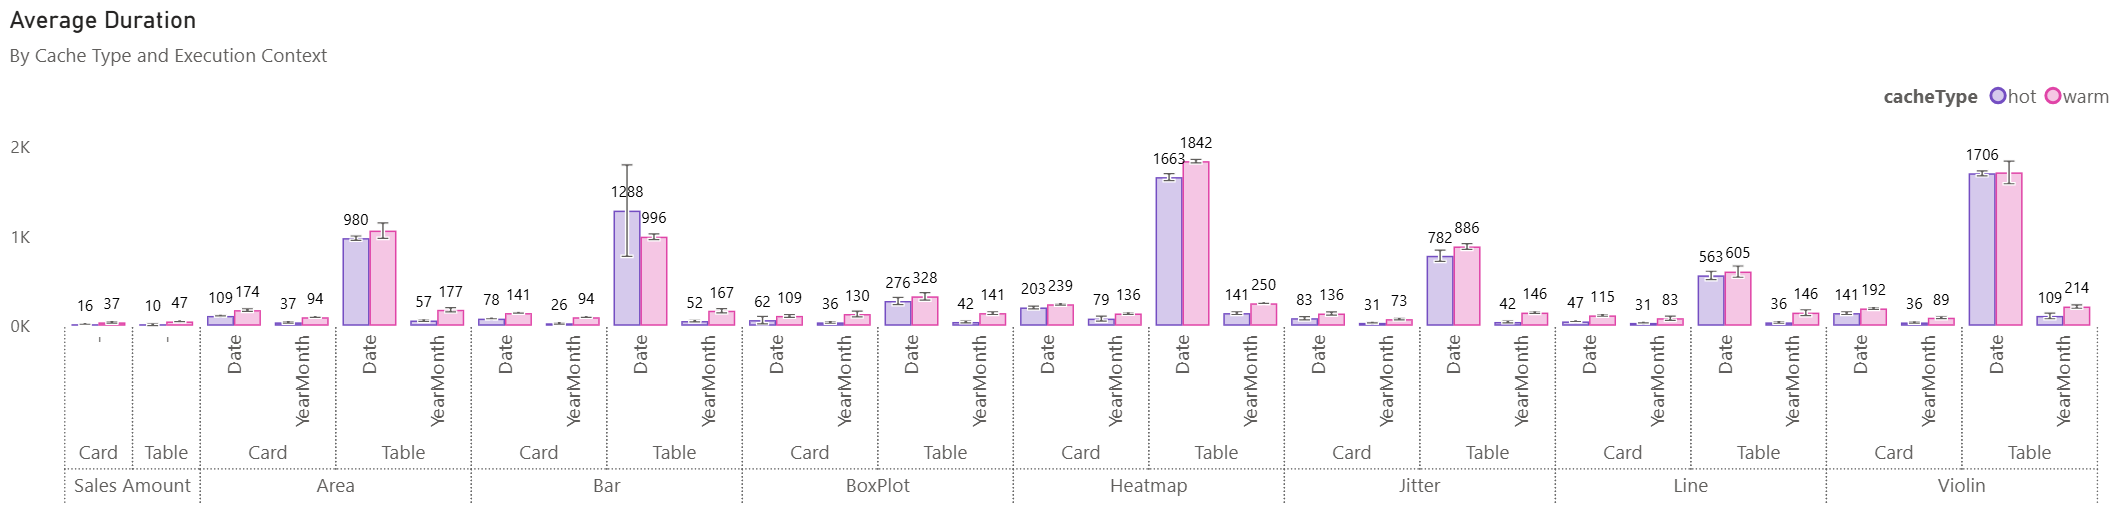
Testing the query performance of DaxLib.SVG Compound functions with the DAX Performance Testing Notebook
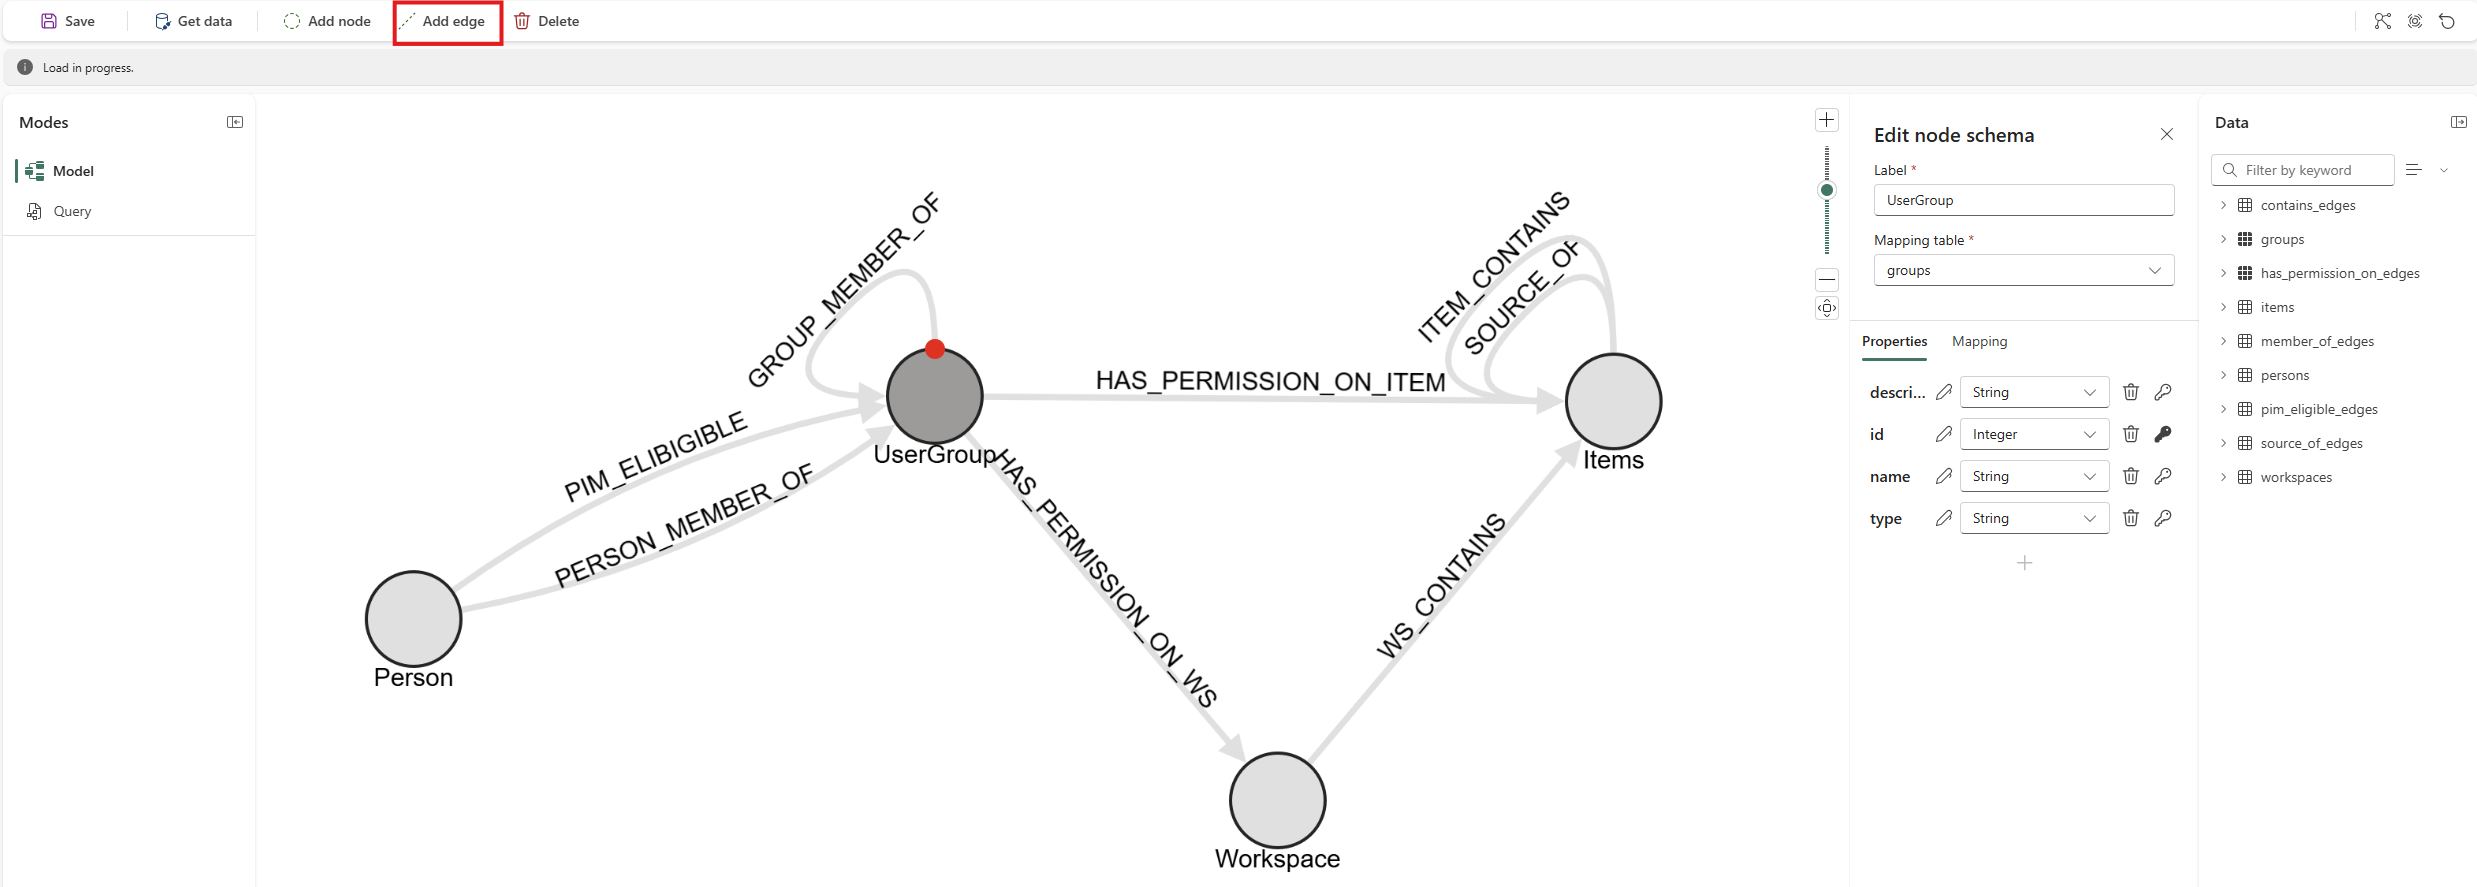
Can you use Fabric Graph To Analyze User Permissions to Fabric Items
Darian Calendar using Calendar-Based Time Intelligence

Auto generate docs for DAX UDF libraries
A year and half of blogging, in numbers

DaxLib.SVG v0.2.0-beta release
How to contribute a Library to DaxLib
A DAX UDF colour library to manipulate HEX colours