Optimizing the SVG Heatmap
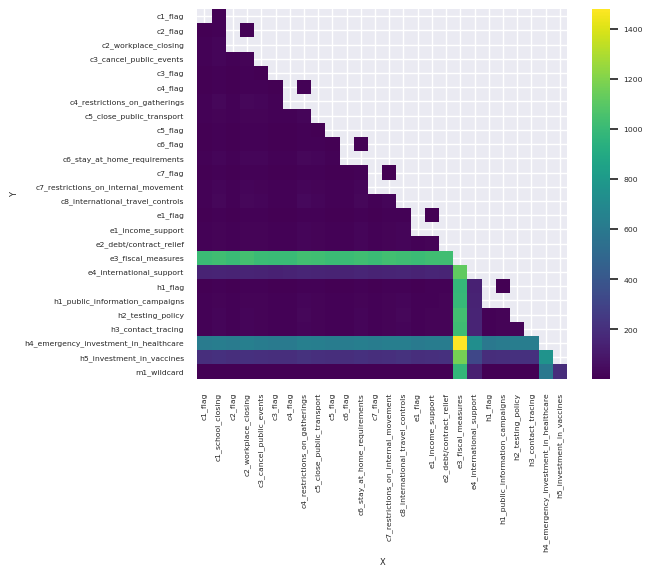
Optimizing the SVG Heatmap using the Sparkline measure pattern
Optimizing the SVG Heatmap using the Sparkline measure pattern
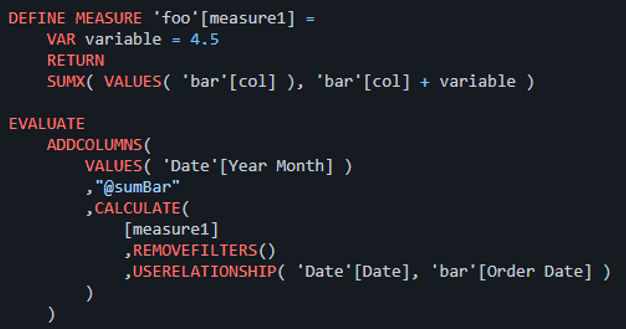
Using the ad hoc measures created by sparklines to optimize SVG generating measures
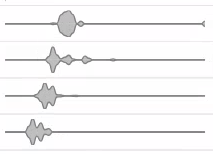
Creating a SVG Violin to visualize distributions in Power BI
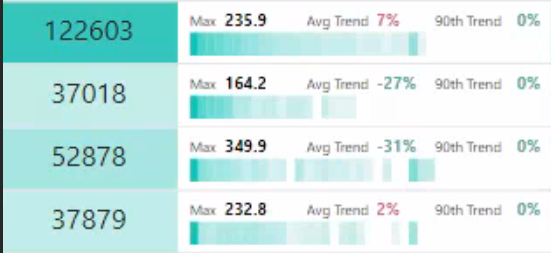
Creating a Heatmap SVG to visualize distributions
Creating a Trend SVG Visual in Power BI
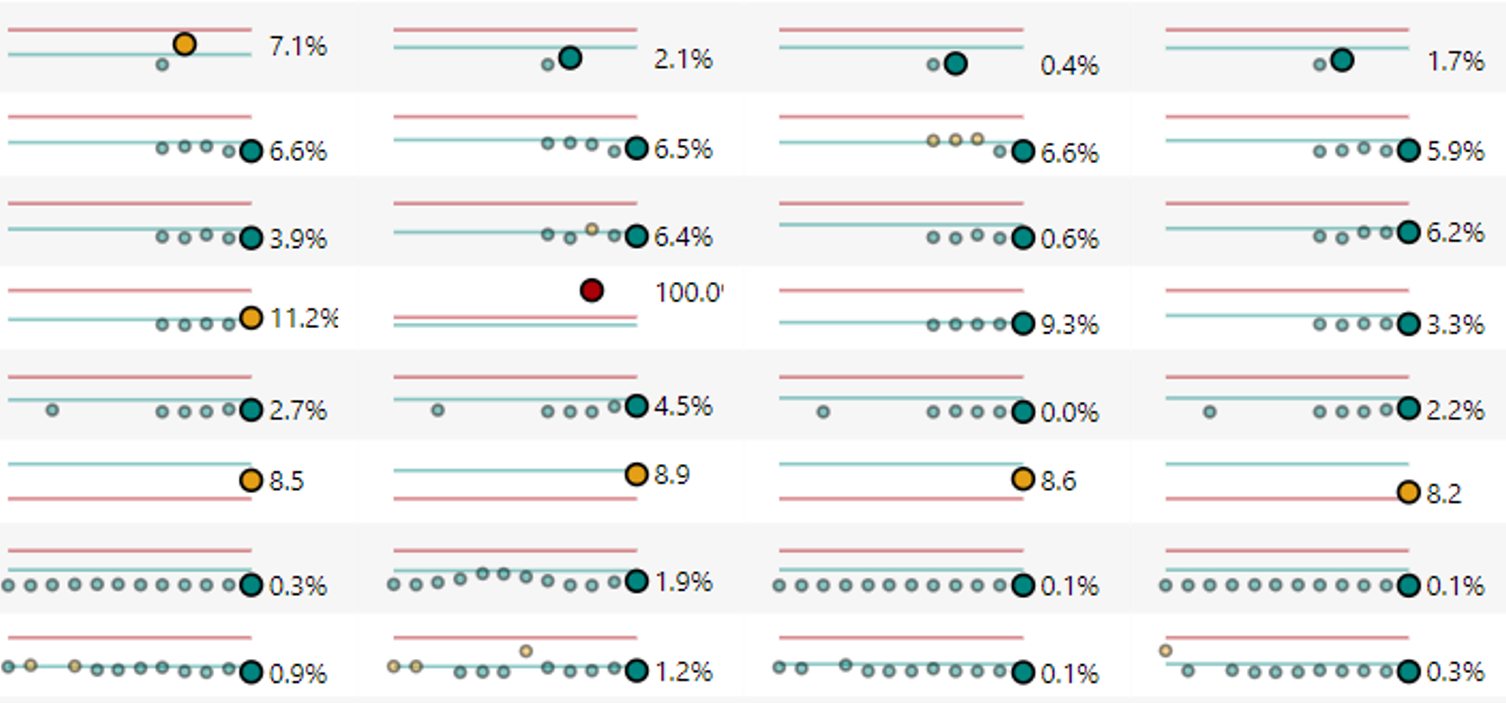
Using DAX to create a SVG Dumbbell chart in Power BI
Defining a Theme in a Git Submodule that can be injected into Reports in other repos upon deployment

How does Delta Lake Uplift a Data Lake to a Lakehouse
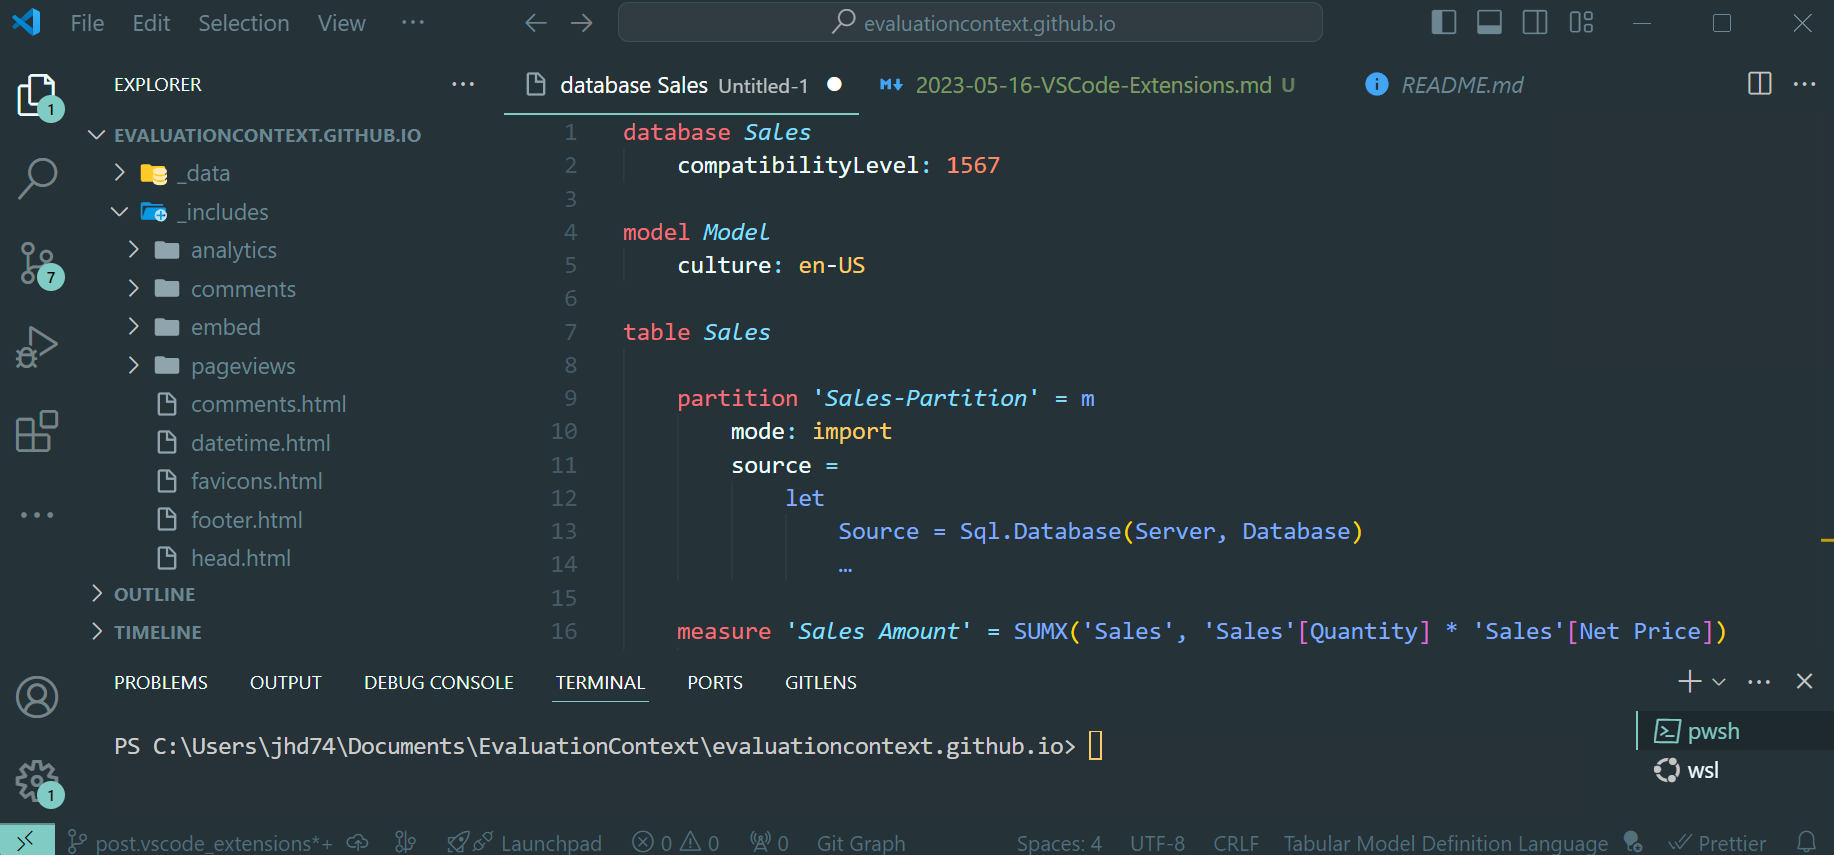
VS Code extension for Power BI Development and Administration
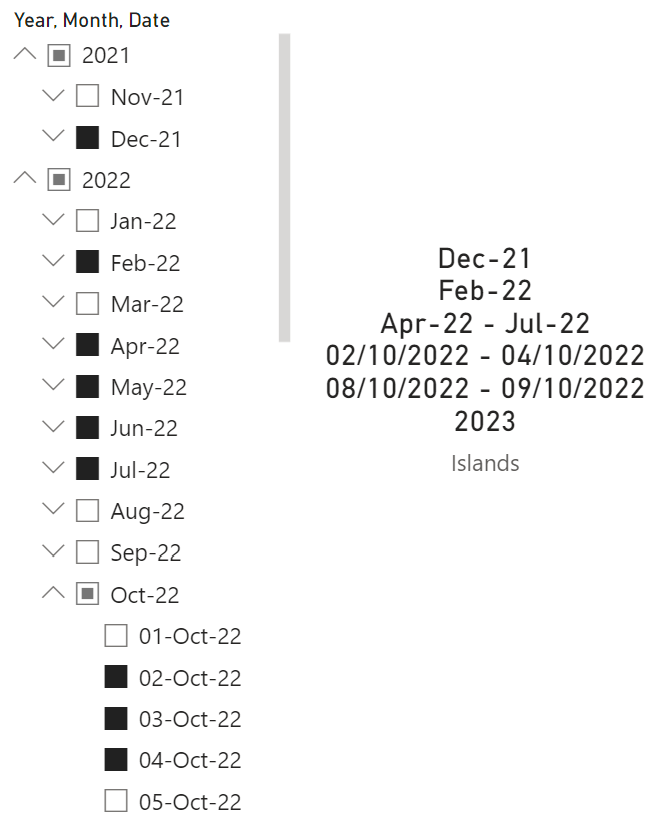
Solving the Island problem in DAX, to return a list of continuous Dates

Rewriting a DAX query that uses TOPN with INDEX to investigate ease of use and performance characteristics
Evaluating the design of Junk Dimension via calculating the Cardinality of Column Combinations
DAX Syntax Highlighting on GitHub Pages with Rouge and highlight.js