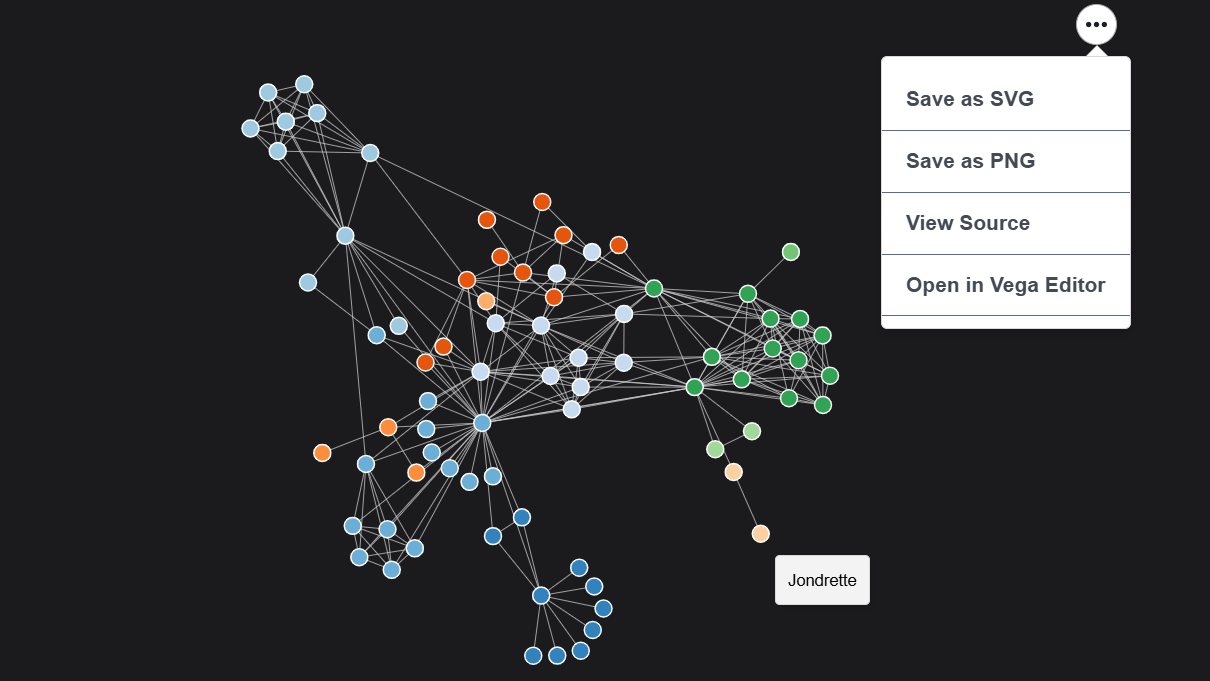
Label Propagation To Identify End User Persona?
Using Label Propagation to attempt to obtain cluster of users that can used to define personas, to simplify granting of permissions
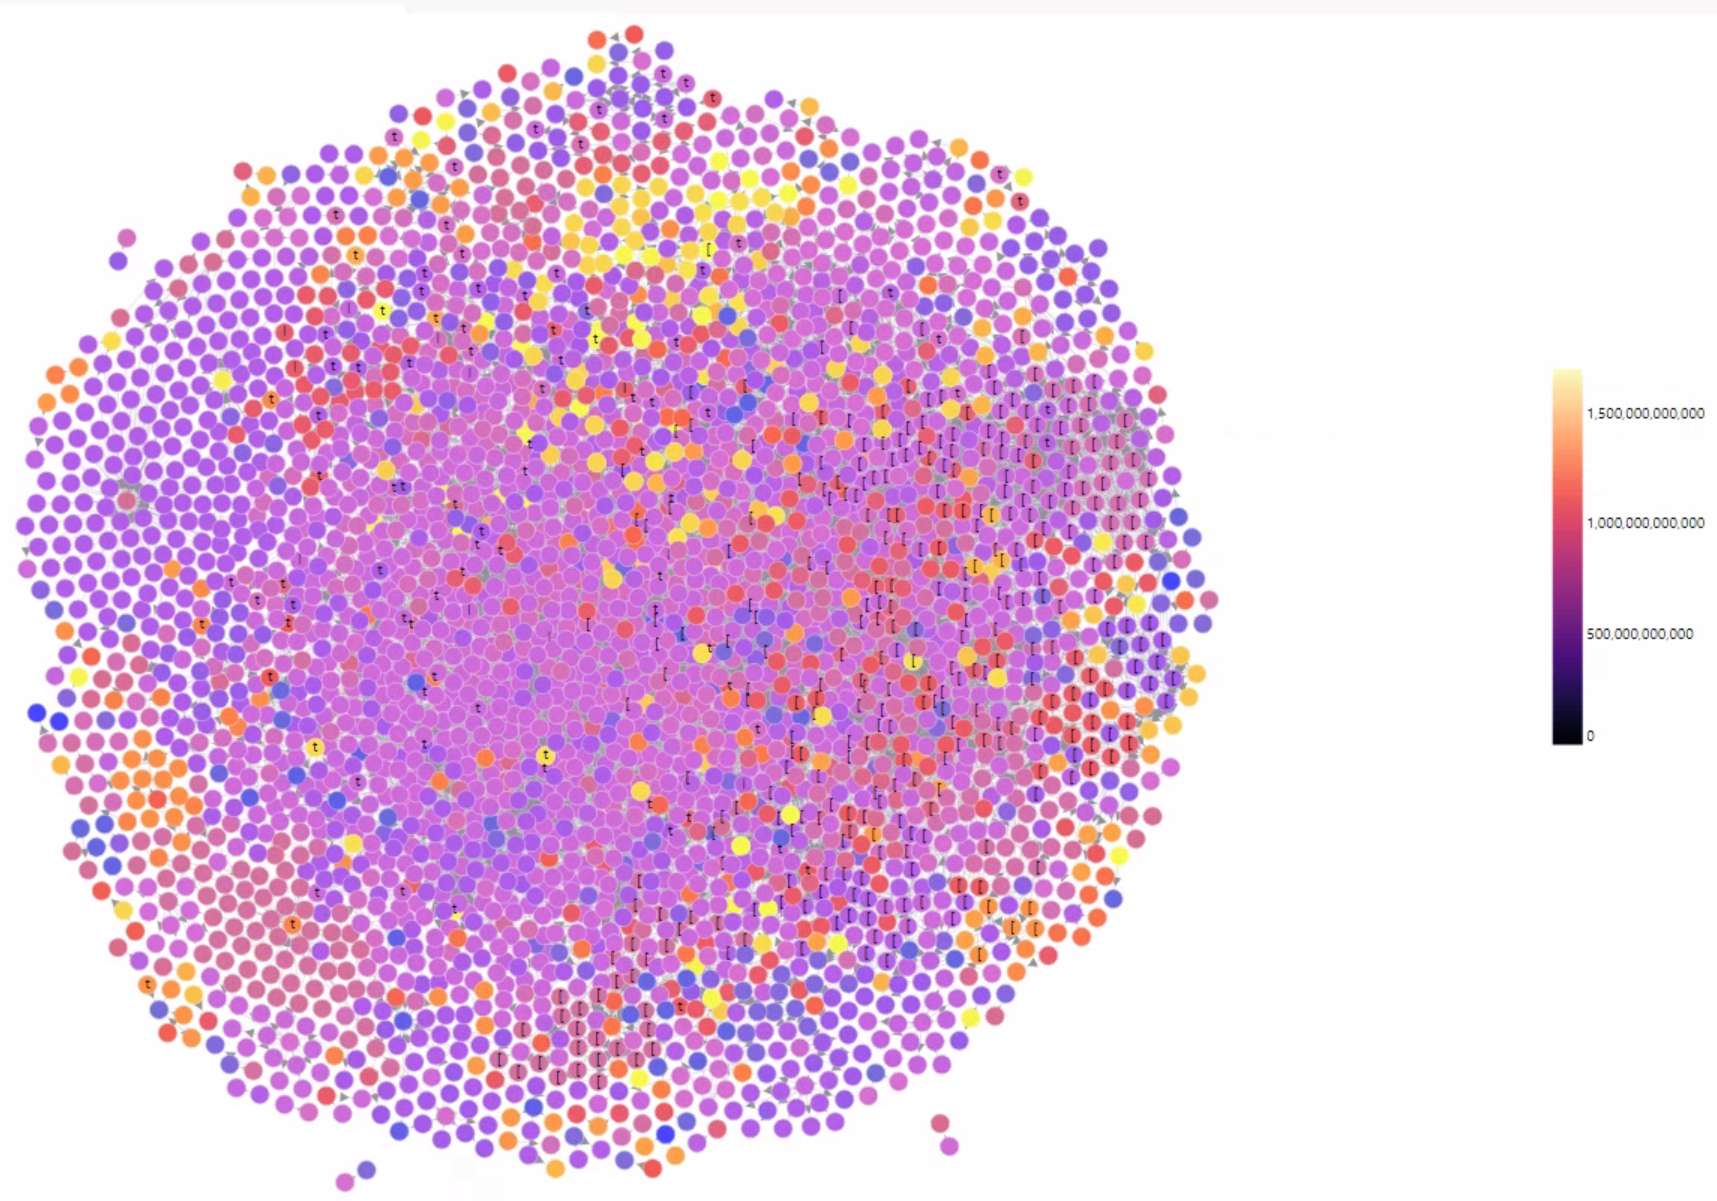
Using Label Propagation to attempt to obtain cluster of users that can used to define personas, to simplify granting of permissions
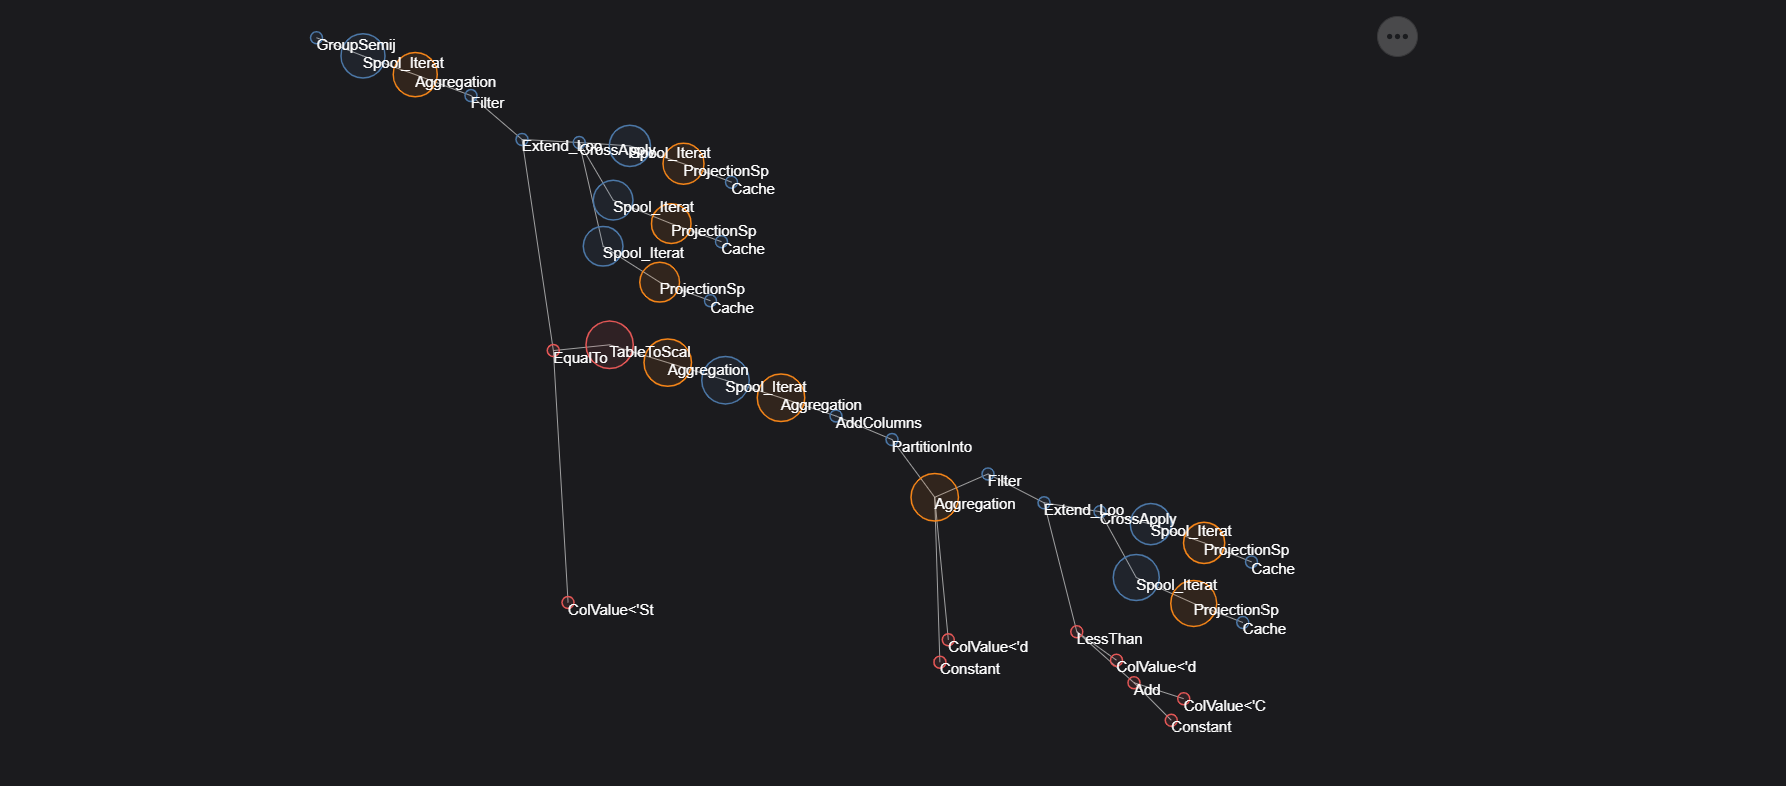
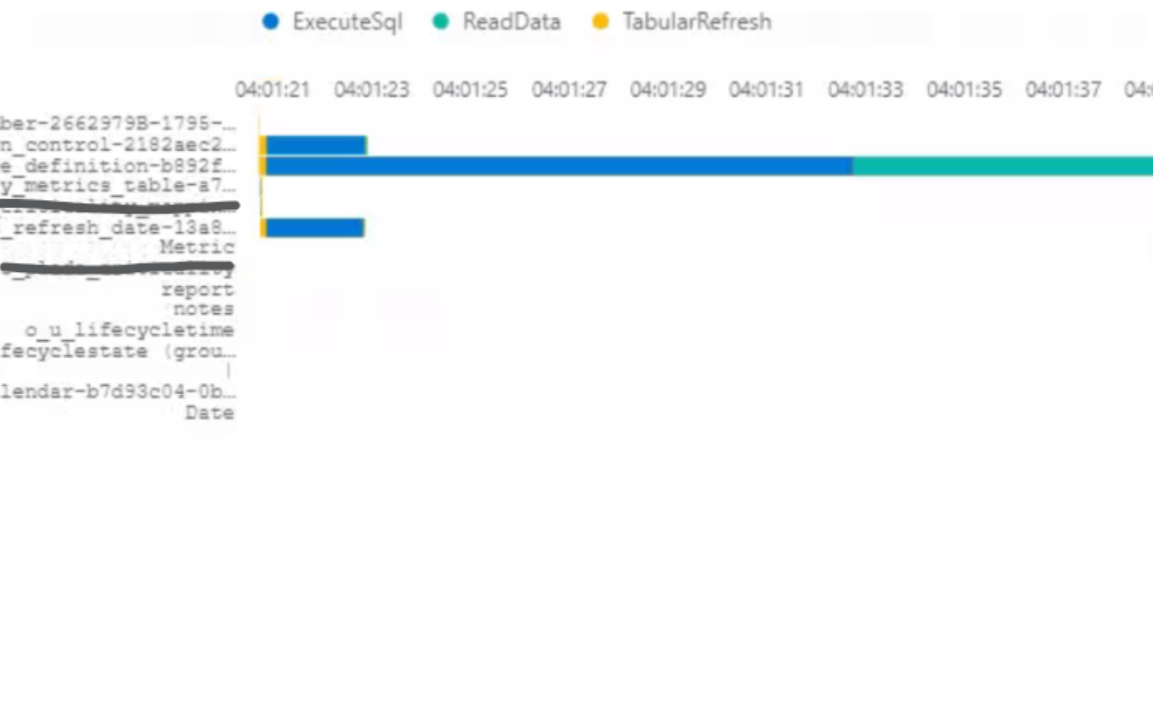
Using Vega Force Directed Graphs to visualizing DAX Query Plans
Using Deneb Force Directed Graph to visualizing the inheritance of Power BI permission
Using Power BI Scanner and GraphFrames to figure out who can access what in Power BI tenant

Installing and using Vega Embed on my Blog
Using Deneb and Vega-Lite to create a Gantt Chart if Power BI
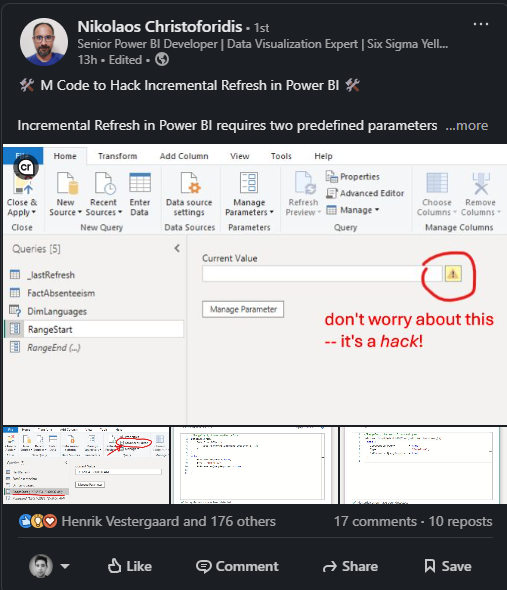
A alternate solution to a solution by Nikolaos Christoforidis for keeping local Incremental Refresh Reports up to date
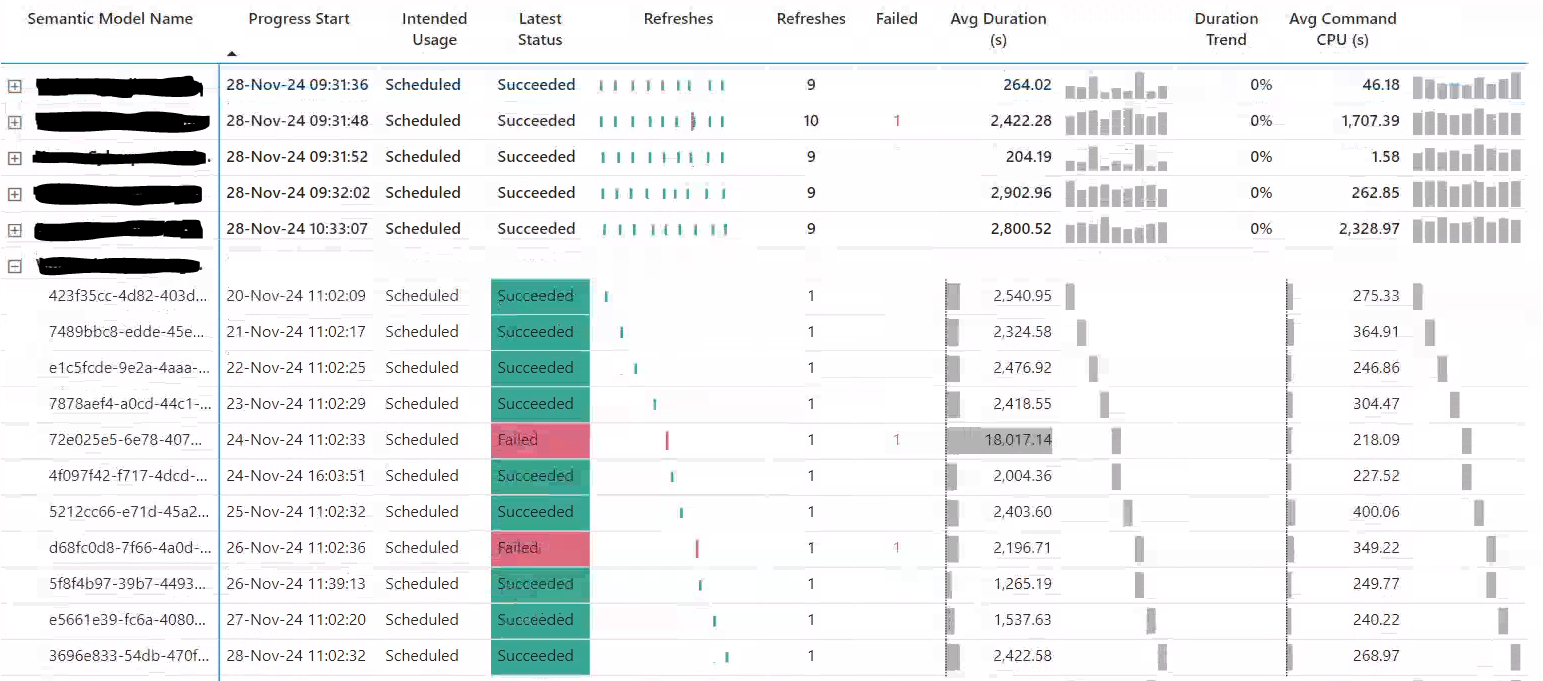
Using Power BI Logs, Report metadata and SVG to visual visual performance and usage with a page heatmap
Optimizing the SVG Heatmap using the Sparkline measure pattern
Using the ad hoc measures created by sparklines to optimize SVG generating measures