SVG Violin Plot
Creating a SVG Violin to visualize distributions in Power BI
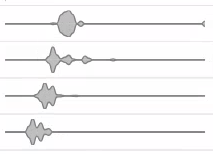
Creating a SVG Violin to visualize distributions in Power BI
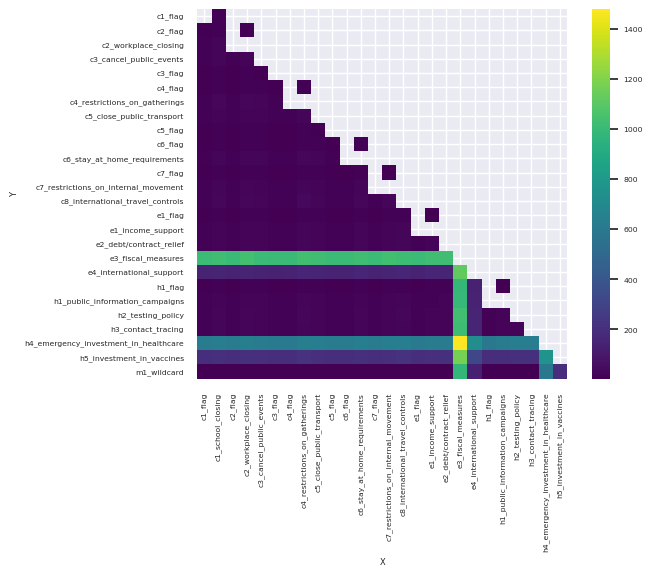
Creating a Heatmap SVG to visualize distributions
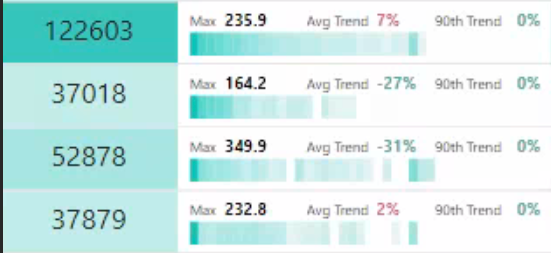
Creating a Trend SVG Visual in Power BI
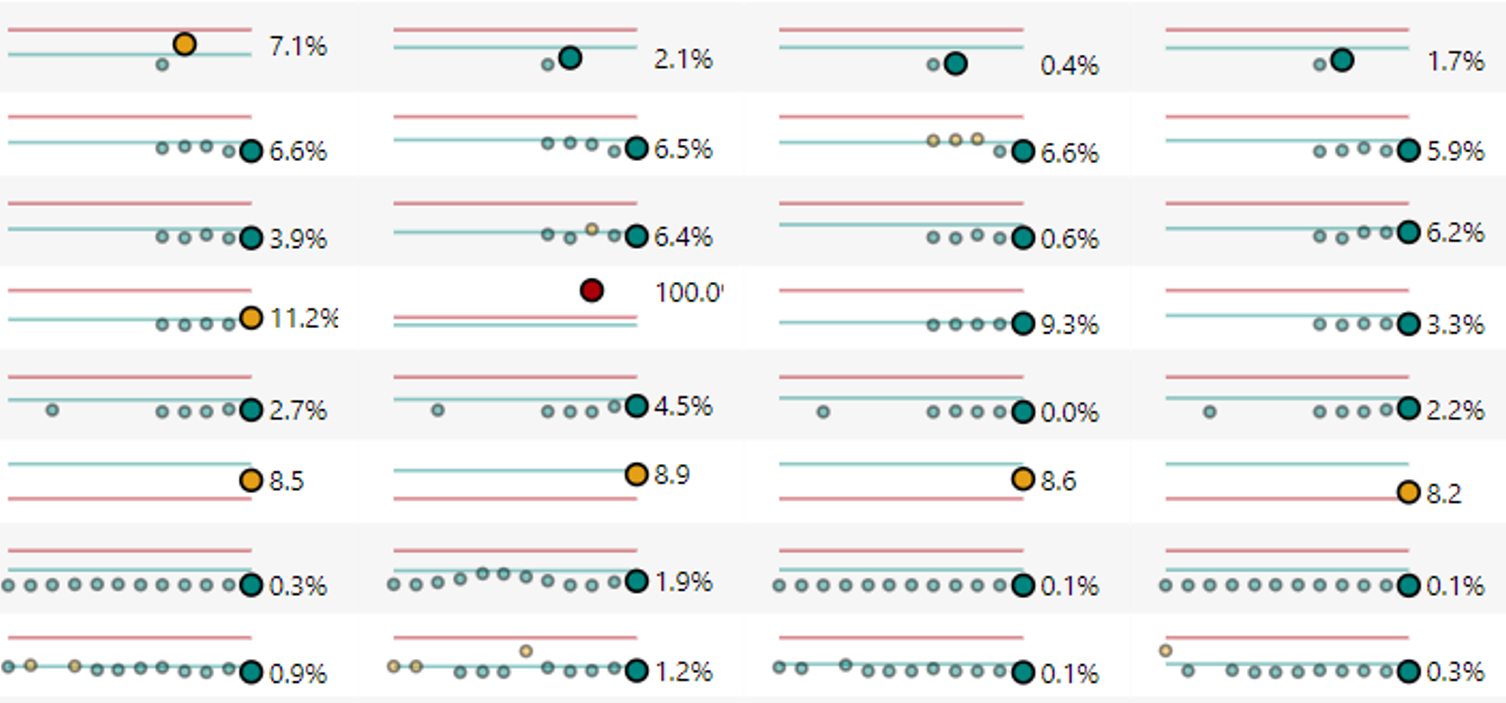
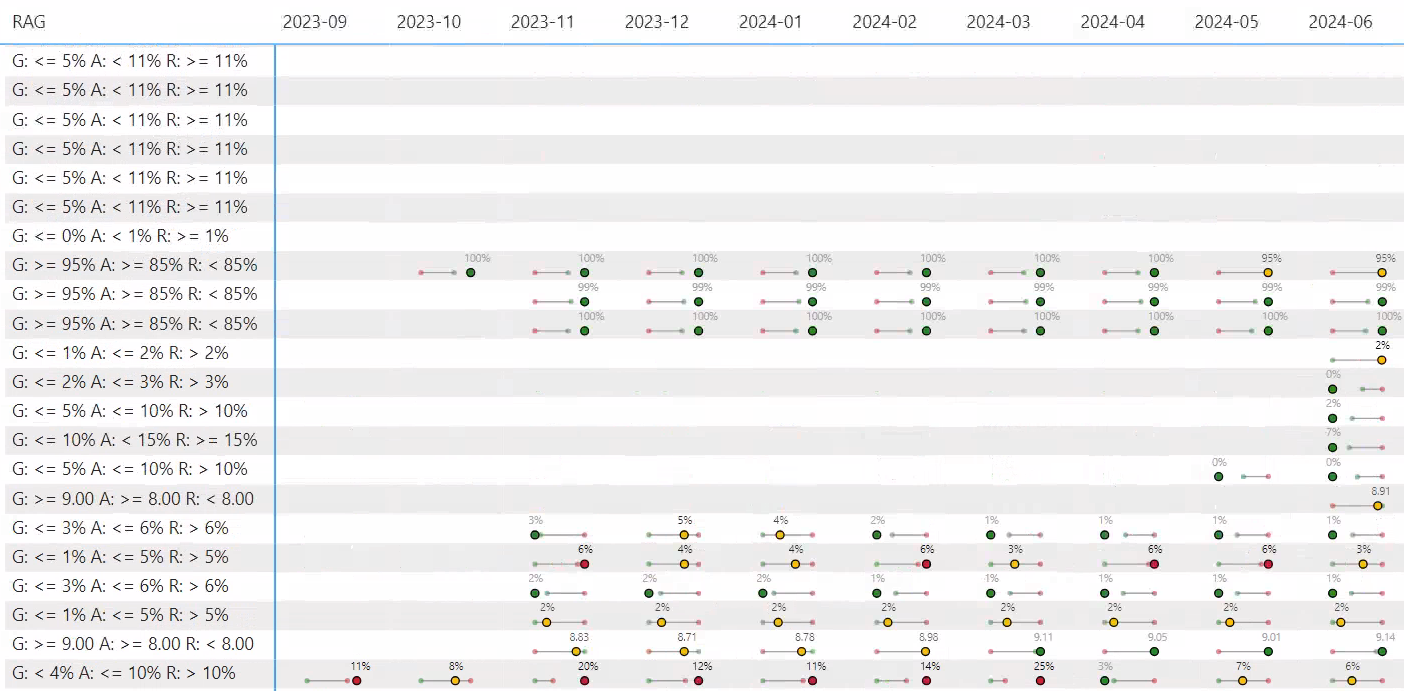
Using DAX to create a SVG Dumbbell chart in Power BI
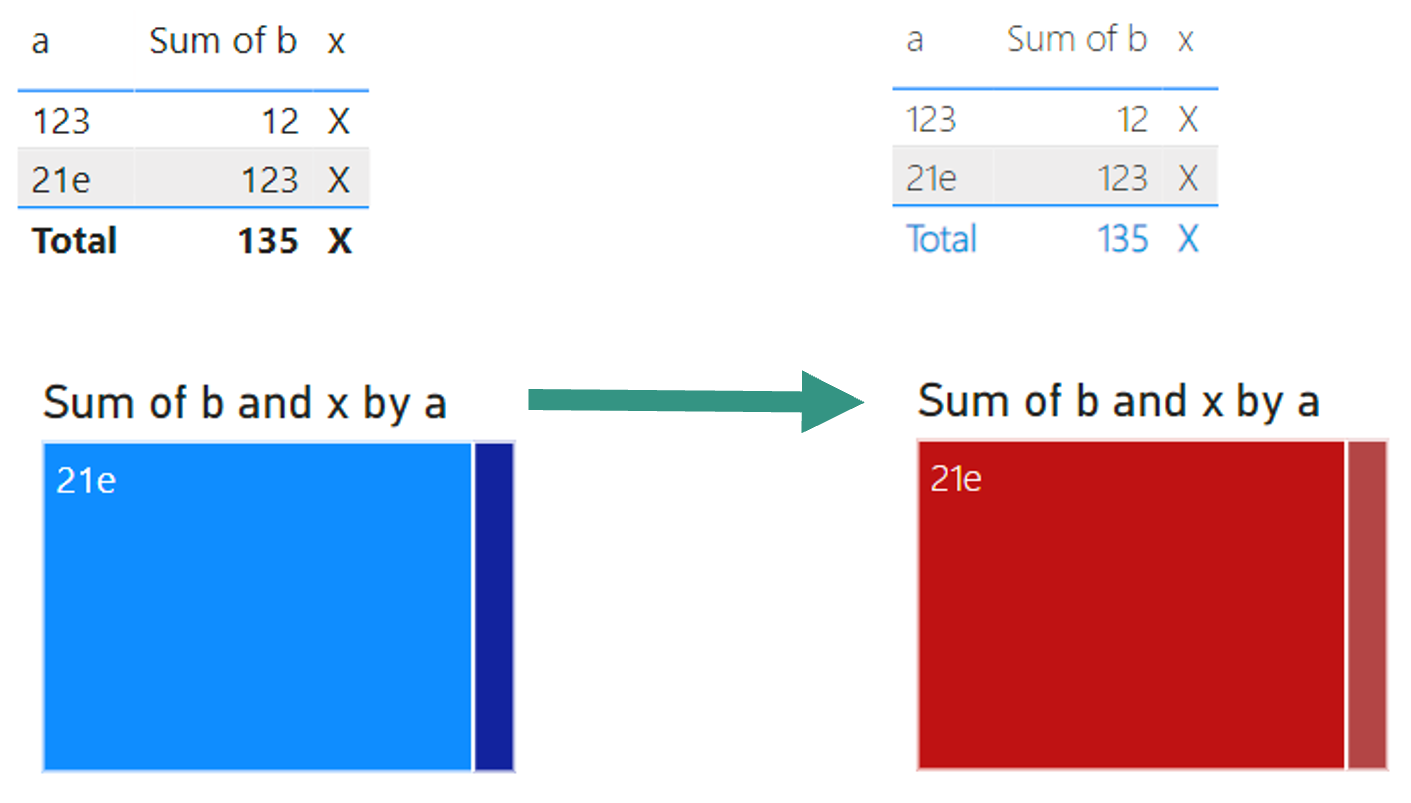
Defining a Theme in a Git Submodule that can be injected into Reports in other repos upon deployment
How does Delta Lake Uplift a Data Lake to a Lakehouse

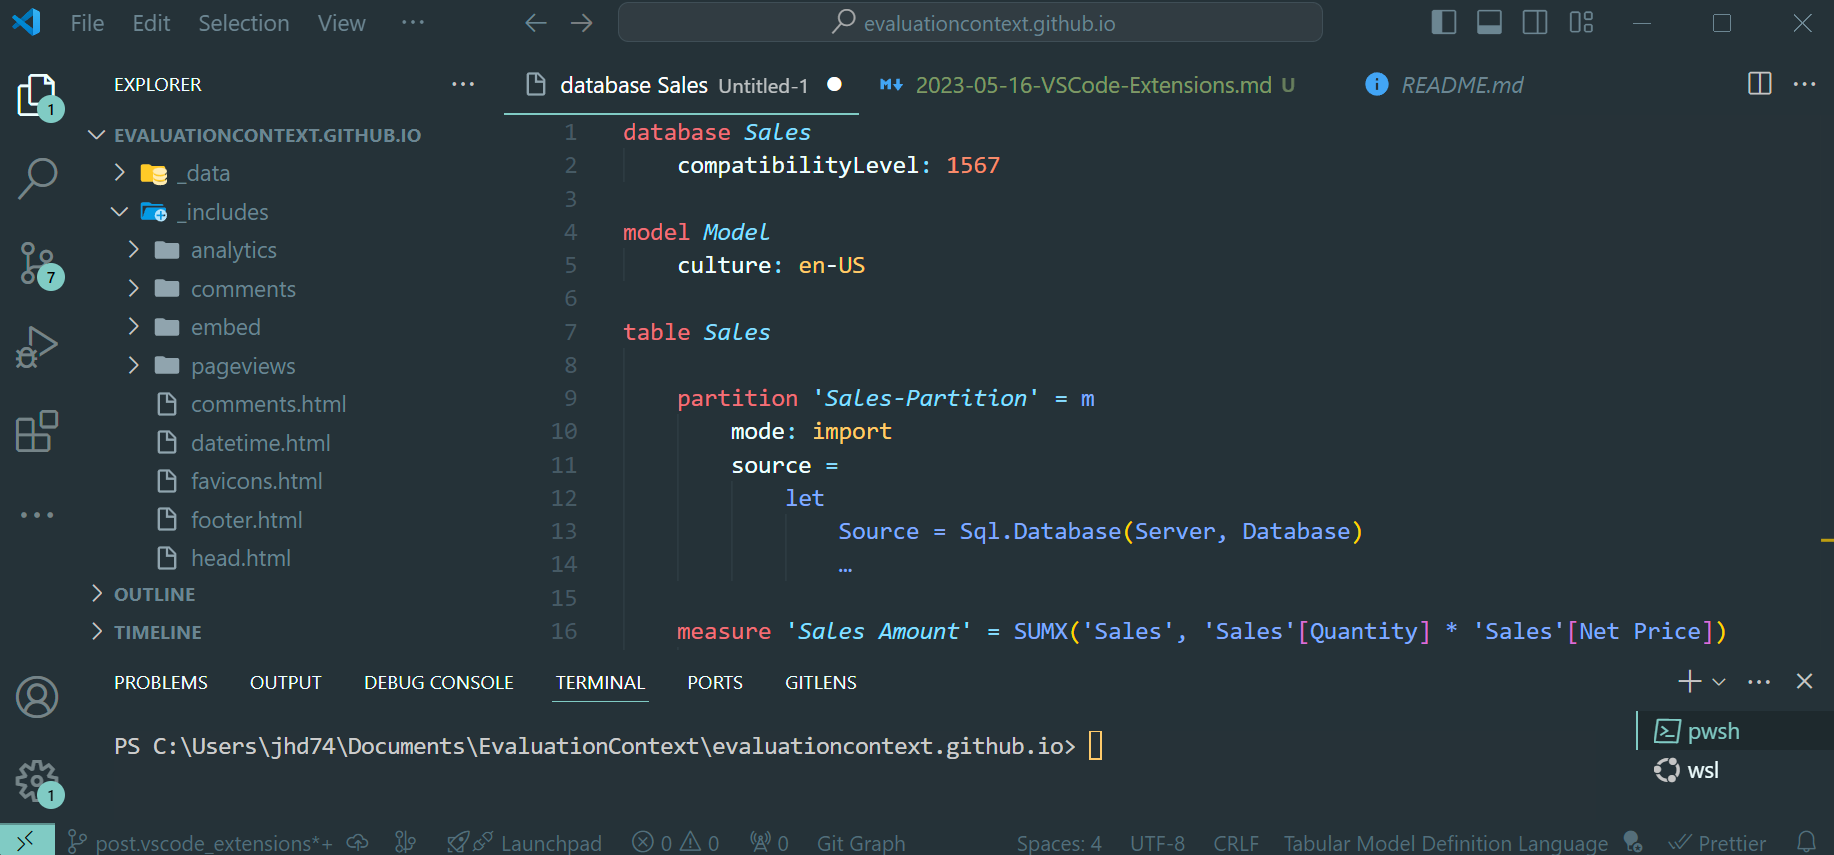
VS Code extension for Power BI Development and Administration
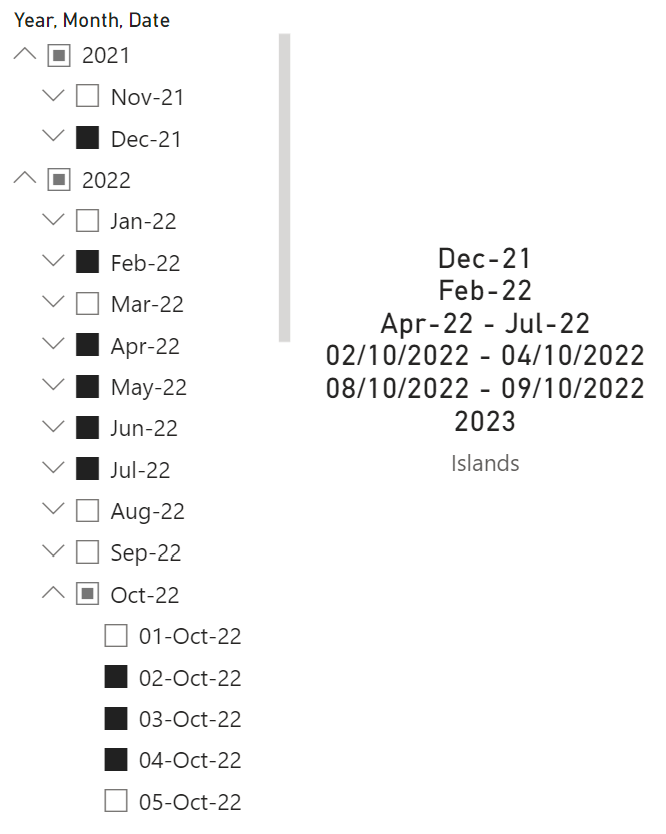
Solving the Island problem in DAX, to return a list of continuous Dates
Rewriting a DAX query that uses TOPN with INDEX to investigate ease of use and performance characteristics
Evaluating the design of Junk Dimension via calculating the Cardinality of Column Combinations